Unlock a world of possibilities! Login now and discover the exclusive benefits awaiting you.
- Qlik Community
- :
- All Forums
- :
- QlikView App Dev
- :
- Re: Stacked Bar chart with 2 expressions and 2 dim...
- Subscribe to RSS Feed
- Mark Topic as New
- Mark Topic as Read
- Float this Topic for Current User
- Bookmark
- Subscribe
- Mute
- Printer Friendly Page
- Mark as New
- Bookmark
- Subscribe
- Mute
- Subscribe to RSS Feed
- Permalink
- Report Inappropriate Content
Stacked Bar chart with 2 expressions and 2 dimensions
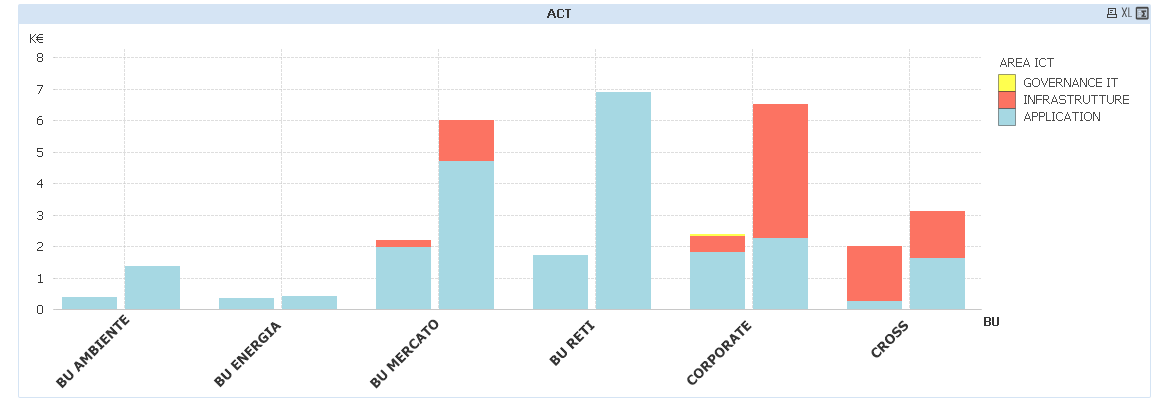
Hi, i want to create a stacked bar chart with 2 expressions (ACT vs BDG) and two dimensions, first one in x axes (BU) and the second one stacked (AREA ICT). I would these two charts in a single one with ACT and BDG side by side:

See qvw attached
- « Previous Replies
-
- 1
- 2
- Next Replies »
Accepted Solutions
- Mark as New
- Bookmark
- Subscribe
- Mute
- Subscribe to RSS Feed
- Permalink
- Report Inappropriate Content
- Mark as New
- Bookmark
- Subscribe
- Mute
- Subscribe to RSS Feed
- Permalink
- Report Inappropriate Content
Like this?
Added a new table in the script:
Dim:
LOAD * Inline [
Dim
1
2
];
and used it as a dimension
=Pick(Dim, 'ACT', 'BDG')
Expression
Pick(Dim, Sum([BUDGET SENZA MANODOPERA]), sum([BUDGET 2017 (Approvato)]))
- Mark as New
- Bookmark
- Subscribe
- Mute
- Subscribe to RSS Feed
- Permalink
- Report Inappropriate Content
Yess, you are a genius! Can you please reattach me the qvw with solution?
- Mark as New
- Bookmark
- Subscribe
- Mute
- Subscribe to RSS Feed
- Permalink
- Report Inappropriate Content
Hi,
Check this.
Regards,
Kaushik Solanki
- Mark as New
- Bookmark
- Subscribe
- Mute
- Subscribe to RSS Feed
- Permalink
- Report Inappropriate Content
Sure
- Mark as New
- Bookmark
- Subscribe
- Mute
- Subscribe to RSS Feed
- Permalink
- Report Inappropriate Content
Super Kaushik! Thank you very much!
- Mark as New
- Bookmark
- Subscribe
- Mute
- Subscribe to RSS Feed
- Permalink
- Report Inappropriate Content
Hi Stefano,
That is not possible with a bar chart; you can show 2 dimensions and 1 expression or 1 dimension and 2 expressions. I think here you have 2 simple possibilities:
- Concatenate 2 dimensions in 1 (=$(=Only(Dimensione)) & '-' & $(=Only(Dettaglio))) and show 2 expressions.
- Use a grid chart
I attach a sample of second option.
Regards,
H
- Mark as New
- Bookmark
- Subscribe
- Mute
- Subscribe to RSS Feed
- Permalink
- Report Inappropriate Content
Very well solved Sunny!
- Mark as New
- Bookmark
- Subscribe
- Mute
- Subscribe to RSS Feed
- Permalink
- Report Inappropriate Content
Thank you 
- Mark as New
- Bookmark
- Subscribe
- Mute
- Subscribe to RSS Feed
- Permalink
- Report Inappropriate Content
Hi, it's possible introduce total? I would 2 bar (one total for Budget and one for Actual)... like this:
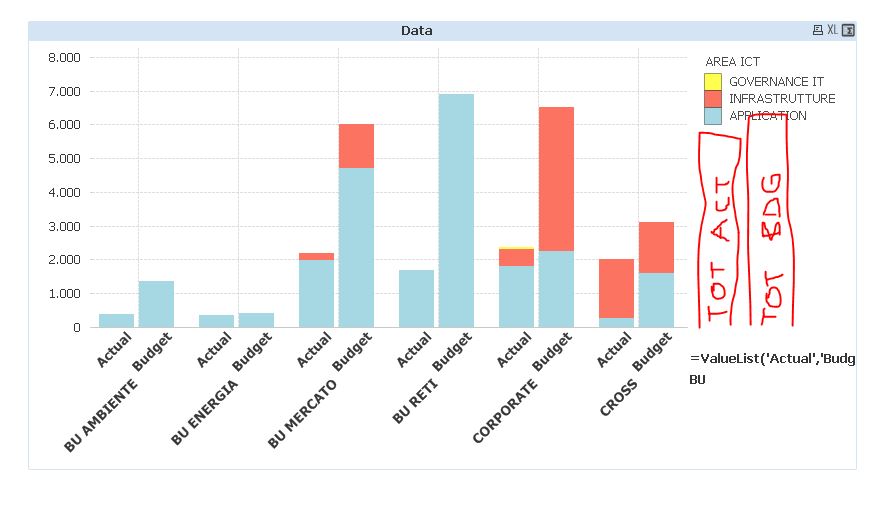
thx
- « Previous Replies
-
- 1
- 2
- Next Replies »