Unlock a world of possibilities! Login now and discover the exclusive benefits awaiting you.
- Qlik Community
- :
- Forums
- :
- Analytics
- :
- App Development
- :
- Re: How to sort items based on spend and i need fi...
- Subscribe to RSS Feed
- Mark Topic as New
- Mark Topic as Read
- Float this Topic for Current User
- Bookmark
- Subscribe
- Mute
- Printer Friendly Page
- Mark as New
- Bookmark
- Subscribe
- Mute
- Subscribe to RSS Feed
- Permalink
- Report Inappropriate Content
How to sort items based on spend and i need figures based on savings in the pie-chart
How to sort items based on spend and i need figures based on savings in the pie-chart.I want to sort only top 3 items and this is my table
| Item ID | Spend | Savings |
| 11 | 120 | 12 |
| 12 | 140 | 14 |
| 13 | 90 | 40 |
| 14 | 30 | 16 |
| 15 | 180 | 18 |
| 16 | 60 | 30 |
| 17 | 110 | 17 |
| 18 | 40 | 8 |
| 19 | 130 | 25 |
| 20 | 160 | 10 |
So pie-chart answer should be like this and NOT like this
Item ID Savings Item ID Savings
15 18 13 40
20 10 16 30
12 14 19 25
Thanks in advance
Regards
Nagarjuna
- Mark as New
- Bookmark
- Subscribe
- Mute
- Subscribe to RSS Feed
- Permalink
- Report Inappropriate Content
My Skype ID : nagarjuna000024@hotmail.com,
If you are free just send me the request we will discuss it. I will be available after one hr.
Thank you
- Mark as New
- Bookmark
- Subscribe
- Mute
- Subscribe to RSS Feed
- Permalink
- Report Inappropriate Content
=if(
Aggr(Rank(Sum(Item ID)), Spend)<=3,
Savings,
'Others'
)
- Mark as New
- Bookmark
- Subscribe
- Mute
- Subscribe to RSS Feed
- Permalink
- Report Inappropriate Content
Unfortunately, I cannot... May be somebody else can offer assistance 
- Mark as New
- Bookmark
- Subscribe
- Mute
- Subscribe to RSS Feed
- Permalink
- Report Inappropriate Content
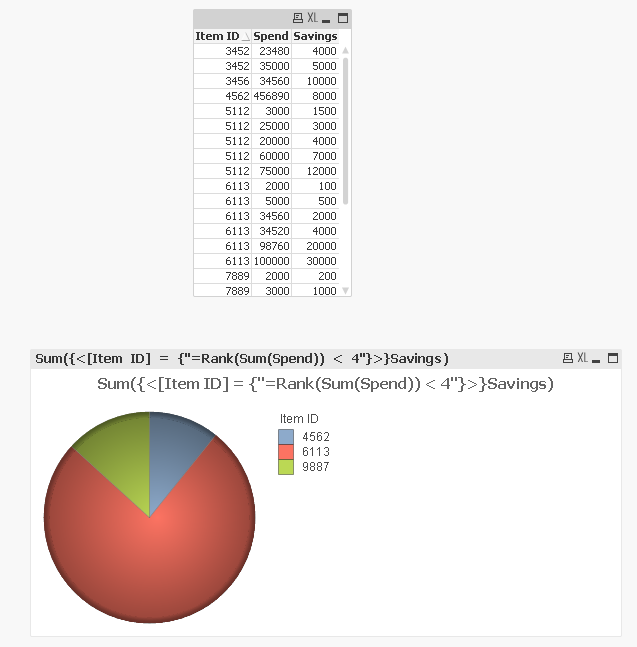
This is my sample data, if u get this correctly then probably works for me. Please do this favor
| Item ID | Spend | Savings |
| 5112 | 3000 | 1500 |
| 5112 | 20000 | 4000 |
| 5112 | 25000 | 3000 |
| 6113 | 34560 | 2000 |
| 7889 | 56000 | 4000 |
| 9887 | 670000 | 6000 |
| 6113 | 34520 | 4000 |
| 9887 | 120000 | 1200 |
| 7889 | 3000 | 1000 |
| 5112 | 75000 | 12000 |
| 7889 | 10000 | 2000 |
| 9887 | 14000 | 1400 |
| 6113 | 98760 | 20000 |
| 3456 | 34560 | 10000 |
| 6113 | 100000 | 30000 |
| 7889 | 2000 | 200 |
| 4562 | 456890 | 8000 |
| 6113 | 2000 | 100 |
| 5112 | 60000 | 7000 |
| 3452 | 23480 | 4000 |
| 9870 | 18000 | 1800 |
| 9870 | 26000 | 2000 |
| 3452 | 35000 | 5000 |
| 6113 | 5000 | 500 |
| 9887 | 12556 | 1234 |
Thanks in advance
Regards
Nagarjuna.
- Mark as New
- Bookmark
- Subscribe
- Mute
- Subscribe to RSS Feed
- Permalink
- Report Inappropriate Content
Is this the expected output?
- Mark as New
- Bookmark
- Subscribe
- Mute
- Subscribe to RSS Feed
- Permalink
- Report Inappropriate Content
Thanks @ sunnny Talwar, now it works for me. I need one more favor , Can i sort only top 2 item? i.e not item 1 and item 2 . It should display only 2nd item based on spend. It should work without match function.
- Mark as New
- Bookmark
- Subscribe
- Mute
- Subscribe to RSS Feed
- Permalink
- Report Inappropriate Content
Hahahaha now it works? I did not change a single thing except using the new data. Expression stayed the exact same.
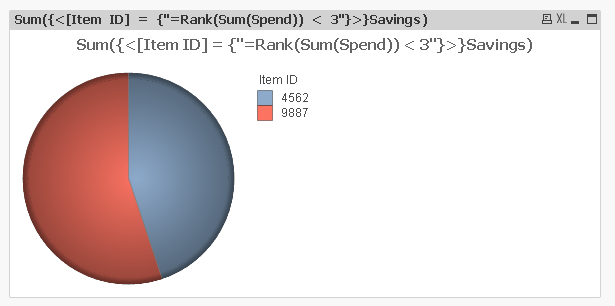
Try this for 2 items
Sum({<[Item ID] = {"=Rank(Sum(Spend)) < 3"}>}Savings)
- Mark as New
- Bookmark
- Subscribe
- Mute
- Subscribe to RSS Feed
- Permalink
- Report Inappropriate Content
I did one mistake, now i understood what it is for the earlier one.Here i need only 4562 item and not 9887 , I have more columns like savings 1, savings 2 and etc for all items , here i want to use bar charts for one item ID , I want to 10 charts for 10 item IDs so wanna sort each item ID i.e Item 1,2,3, and etc is this possible? when i sort item IDs it should display based on spend only.
- Mark as New
- Bookmark
- Subscribe
- Mute
- Subscribe to RSS Feed
- Permalink
- Report Inappropriate Content
What is a point of pie chart with just one item? Anyways, try this
Sum({<[Item ID] = {"=Rank(Sum(Spend)) < 3 and Rank(Sum(Spend)) > 1"}>}Savings)
I have no idea what you mean here:
I have more columns like savings 1, savings 2 and etc for all items , here i want to use bar charts for one item ID , I want to 10 charts for 10 item IDs so wanna sort each item ID i.e Item 1,2,3, and etc is this possible? when i sort item IDs it should display based on spend only.
Can you share a sample and also please provide the desired output from the same provided
- Mark as New
- Bookmark
- Subscribe
- Mute
- Subscribe to RSS Feed
- Permalink
- Report Inappropriate Content
Dear Nagarjuna Vattikuti
fine the attach file and pay attention to Dimension Limits tab and sort tab