Unlock a world of possibilities! Login now and discover the exclusive benefits awaiting you.
- Qlik Community
- :
- Forums
- :
- Analytics
- :
- New to Qlik Analytics
- :
- Re: Year/month dimensions
- Subscribe to RSS Feed
- Mark Topic as New
- Mark Topic as Read
- Float this Topic for Current User
- Bookmark
- Subscribe
- Mute
- Printer Friendly Page
- Mark as New
- Bookmark
- Subscribe
- Mute
- Subscribe to RSS Feed
- Permalink
- Report Inappropriate Content
Year/month dimensions
Hi all
This may get quite convoluted pretty quickly, so bear with me!
Ok, so I'm using Qlik Sense Server.
I have a data connection to quite a large table of data, which is basically client agreements dating back to 2003, and these agreements are for a variety of different products.
The table contains a huge amount of data (over 70,000 agreement details), but the columns I'm specifically talking about in this situation are 'EFF_START_DT', which is the date the agreement started, and 'EFF_END_DT', which, for agreements that have expired/been cancelled etc., the date the agreement ended.
I am building an app which I want to show, by month/year, the number of agreements that ended that month (either showing a full year by month, or select filter on selected months), and the base of agreements still active as of that month.
Now, I have managed to get it working for the Ended subs view, which was relatively simple, as I just made the date dimensions (month and year) based on the EFF_END_DT, (month(EFF_END_DT)), and counting the numbers of subs that ended that year/month, (count(AGREE_NUM)).
However, the issue I have now is I can't for the life of me work out how to incorporate the total number of subs still active as of that same month/year i.e. the EFF_END_DT is null.
Even if I have a completely different App for the base numbers of subs, how do I script something that beings back the number of active subs as of (for example) February 2017, or a full year view of 2016 showing the base growth month by month?
I really don't want to have a separate app though, which adds a whole lot of complexity.
Here is an example of the background script in the data load editor (it's greatly abridged - I'm selecting dozens of columns and have a lot of case statements to group products etc)
Select
AGREE_ID
,AGREE_NUM
,EFF_START_DT
,EFF_END_DT
,AGREE_STATUS
from
CX_LKP_RECURRING_AGREEMENTS_BASE
where EFF_START_DT <= getdate()
and year(EFF_START_DT) >= 2003
Thanks!
- « Previous Replies
- Next Replies »
- Mark as New
- Bookmark
- Subscribe
- Mute
- Subscribe to RSS Feed
- Permalink
- Report Inappropriate Content
Can you please post some sample data
- Mark as New
- Bookmark
- Subscribe
- Mute
- Subscribe to RSS Feed
- Permalink
- Report Inappropriate Content
| AGREE_ID | AGREE_NUM | AGREE_STATUS | EFF_START_DT | EFF_END_DT | BU_ID | AGREEMENT_PRODUCT_GROUP |
| 356001 | SUBS5093124 | Expired | 16/09/2007 | 31/08/2009 | 1-14J-1 | Basics |
| 2355889 | SUBS5093121 | Expired | 1/03/2007 | 13/02/2017 | 1-14J-1 | Basics |
| 2111177 | SUBS5093540 | Expired | 1/05/2008 | 1/06/2016 | 1-14J-1 | Standard |
| 223358 | SUBS5090633 | Active | 1/03/2007 | NULL | 1-14J-1 | Basics |
| 211111 | SUBS5090576 | Cancelled | 13/06/2009 | 1/06/2011 | 1-14J-1 | Standard |
| 698889 | SUBS5093108 | Active | 1/03/2007 | NULL | 1-14J-1 | Basics |
| 56689777 | SUBS5090571 | Expired | 1/03/2010 | 30/04/2011 | 1-14J-1 | Basics |
| 11554487 | SUBS5090606 | Expired | 16/03/2007 | 14/07/2008 | 1-14J-1 | Standard |
| 32566699 | SUBS5090566 | Cancelled | 1/12/2008 | 7/01/2009 | 1-14J-1 | Basics |
| 8755789 | SUBS5091058 | Active | 1/03/2007 | NULL | 1-14J-1 | Standard |
- Mark as New
- Bookmark
- Subscribe
- Mute
- Subscribe to RSS Feed
- Permalink
- Report Inappropriate Content
I may not have fully understood the issue, but it seems that you might need to use IntervalMatch between your start and end date and a master calendar field. Based on the data provided, what is the expected output you are hoping to get?
- Mark as New
- Bookmark
- Subscribe
- Mute
- Subscribe to RSS Feed
- Permalink
- Report Inappropriate Content
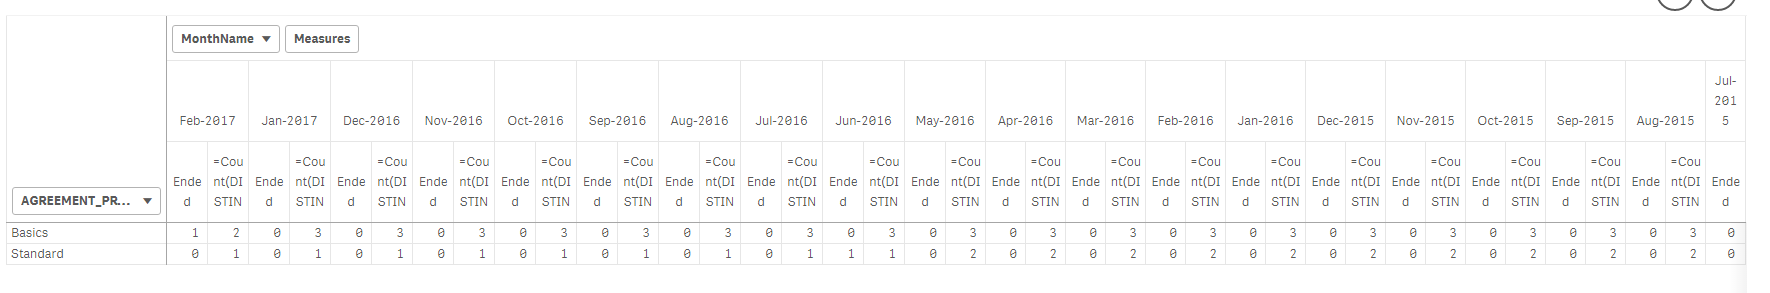
Ok, based on the data I provided, I would be hoping to get, in a table (or pivot-table) and bar chart:
If February 2017 is selected in the filter pane, and no product selected, it would show 1 agreement ended, and a base of 3 active agreements.
If the same date selected, but 'Basics' selected as the product, still 1 agreement ended, with a base of 2 active agreements.
No month selected, but 2011 only, the table and bar graph showing 1 agreement ending in April and 1 in June, with the base showing 7 active agreements for each month Jan-Mar, 6 for May, and 5 for each month for the rest of the year.
Hope that makes sense!
- Mark as New
- Bookmark
- Subscribe
- Mute
- Subscribe to RSS Feed
- Permalink
- Report Inappropriate Content
See if this looks like something you want
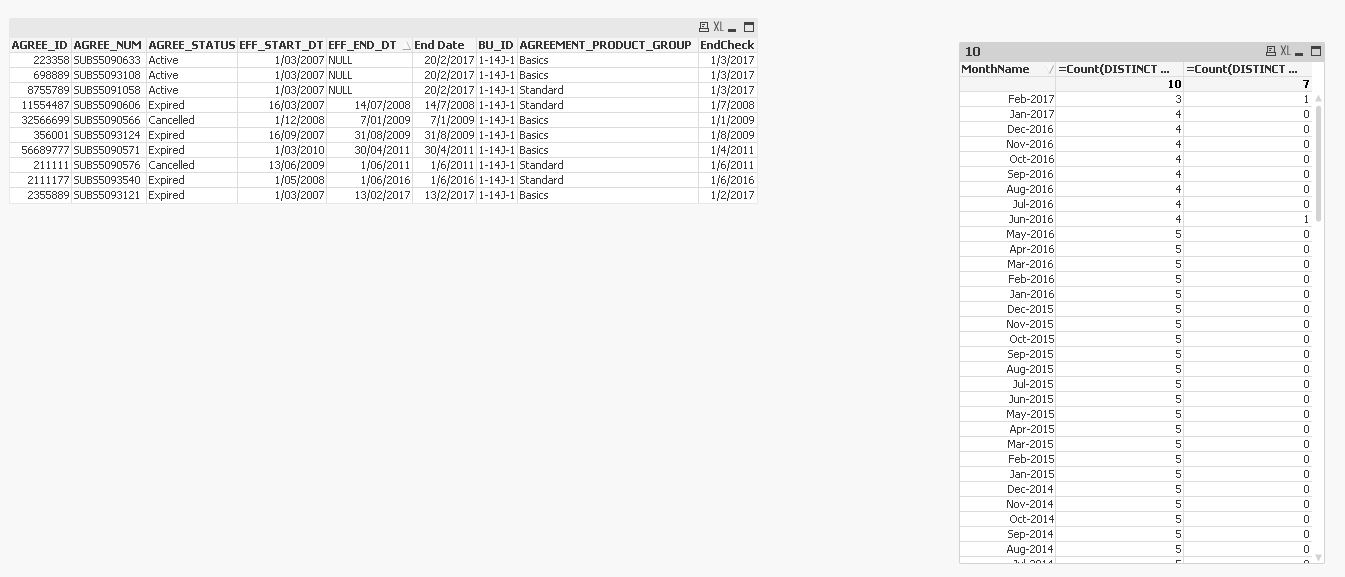
Script (Coded in QlikView, but should be same for Qlik Sense)
Table:
LOAD AGREE_ID,
AGREE_NUM,
AGREE_STATUS,
EFF_START_DT,
EFF_END_DT,
Date(If(EFF_END_DT = 'NULL', Today(), EFF_END_DT)) as [End Date],
If(EFF_END_DT = 'NULL', MonthStart(Today(), 1), MonthStart(EFF_END_DT)) as EndCheck,
BU_ID,
AGREEMENT_PRODUCT_GROUP
FROM
[https://community.qlik.com/thread/250638]
(html, codepage is 1252, embedded labels, table is @1);
Calendar:
LOAD Date(MinDate + IterNo() - 1) as Date,
Date(MonthStart(MinDate + IterNo() - 1), 'MMM-YYYY') as MonthName
While MinDate + IterNo() - 1 <= Today();
LOAD Min(EFF_START_DT) as MinDate
Resident Table;
IntervalMatch:
IntervalMatch(Date)
LOAD EFF_START_DT,
[End Date]
Resident Table;
- Mark as New
- Bookmark
- Subscribe
- Mute
- Subscribe to RSS Feed
- Permalink
- Report Inappropriate Content
Kind of yes, except it will only be a single year view (or a single month if selected).
Imagine the Qlik Sense version of this (with the little boxes at the top showing Month/Ended/Base/% Ended:

And sorry - not sure where your script would go? What does "Table:" "Calendar:" and "Resident Table;" refer to please?
And I can't add an "End Check" to the data table sorry - I don't have control over the table at all - the columns are as is.
- Mark as New
- Bookmark
- Subscribe
- Mute
- Subscribe to RSS Feed
- Permalink
- Report Inappropriate Content
See if the attached helps
- Mark as New
- Bookmark
- Subscribe
- Mute
- Subscribe to RSS Feed
- Permalink
- Report Inappropriate Content
Time for a real numpty question sorry - how do I view a QVF file?
I don't have access to the QMC, btw.
And something else I should mention sorry. I need to be able to select the Year and Month independently.
For example, choose 2016, with no month selected, to show all 12 months.
Or, 2016 and June, to show just June 2016.
- Mark as New
- Bookmark
- Subscribe
- Mute
- Subscribe to RSS Feed
- Permalink
- Report Inappropriate Content
Do you have Qlik Sense desktop installed on your machine? If you do then drag the file onto a Qlik Sense desktop to open the qvf.
For filtering on Month and Year, you can create Month and Year filters for making selections
- « Previous Replies
- Next Replies »