Unlock a world of possibilities! Login now and discover the exclusive benefits awaiting you.
- Qlik Community
- :
- Forums
- :
- Analytics
- :
- New to Qlik Analytics
- :
- Re: Cumulative
- Subscribe to RSS Feed
- Mark Topic as New
- Mark Topic as Read
- Float this Topic for Current User
- Bookmark
- Subscribe
- Mute
- Printer Friendly Page
- Mark as New
- Bookmark
- Subscribe
- Mute
- Subscribe to RSS Feed
- Permalink
- Report Inappropriate Content
Cumulative
Hello All
I need a urgent help.. Please help me in this scenario.
I am calculating the running total in visualization based on the months.
When I click on any particular month, the running total is failed.
Is there any way to fix the running total??
I tried to use {1} value to make them static but the issue with that I am not able to filter that value via different filters
Thanks!!
- « Previous Replies
- Next Replies »
Accepted Solutions
- Mark as New
- Bookmark
- Subscribe
- Mute
- Subscribe to RSS Feed
- Permalink
- Report Inappropriate Content
1) You don't have to call me sir  . My name is Sunny
2) I already gave you the option to use this expression
RangeSum(Above(Count({<Active_Month, Active_Date>}DISTINCT AccID), 0, RowNo())) * Avg(1)
- Mark as New
- Bookmark
- Subscribe
- Mute
- Subscribe to RSS Feed
- Permalink
- Report Inappropriate Content
- Mark as New
- Bookmark
- Subscribe
- Mute
- Subscribe to RSS Feed
- Permalink
- Report Inappropriate Content
Thanks Andrey for the help.
I have already used the formula you mentioned in the link but the issue is that I can not able to drill down any particular month. The running total fails
Please help me in this scenario
Hello Sunny @Sunny Talwar I read your various sections. Can you please suggest me something
Regards
DC
- Mark as New
- Bookmark
- Subscribe
- Mute
- Subscribe to RSS Feed
- Permalink
- Report Inappropriate Content
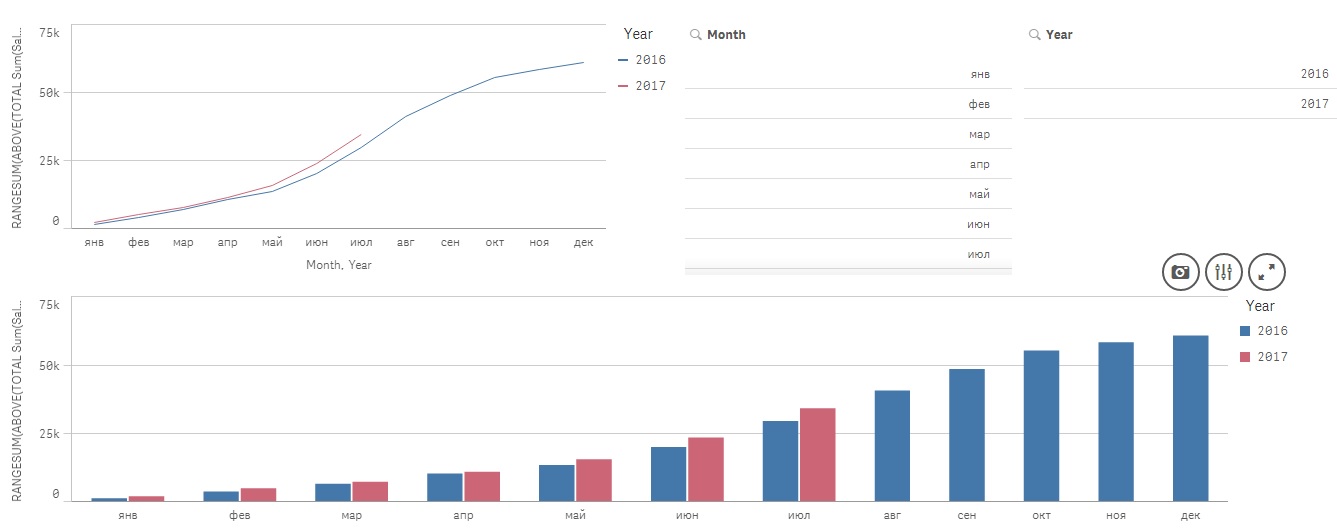
On sheet of Qlik Sense create a new line chart or bar chart. Add Year and Month as the dimensions (or Month-Year - that is in your data). As a measure, use the expression
RANGESUM(ABOVE(TOTAL Sum(Sales),0, ROWNO(TOTAL))),
where Sales - field field with cumulative sum.
An example of the attached file.
The result, as in the example variant visualization
Regards,
Andrey
- Mark as New
- Bookmark
- Subscribe
- Mute
- Subscribe to RSS Feed
- Permalink
- Report Inappropriate Content
What is your current expression? What is your dimension?
- Mark as New
- Bookmark
- Subscribe
- Mute
- Subscribe to RSS Feed
- Permalink
- Report Inappropriate Content
Thanks Andrey for your response.
I follow the above steps. I need the data only Monthly basis.
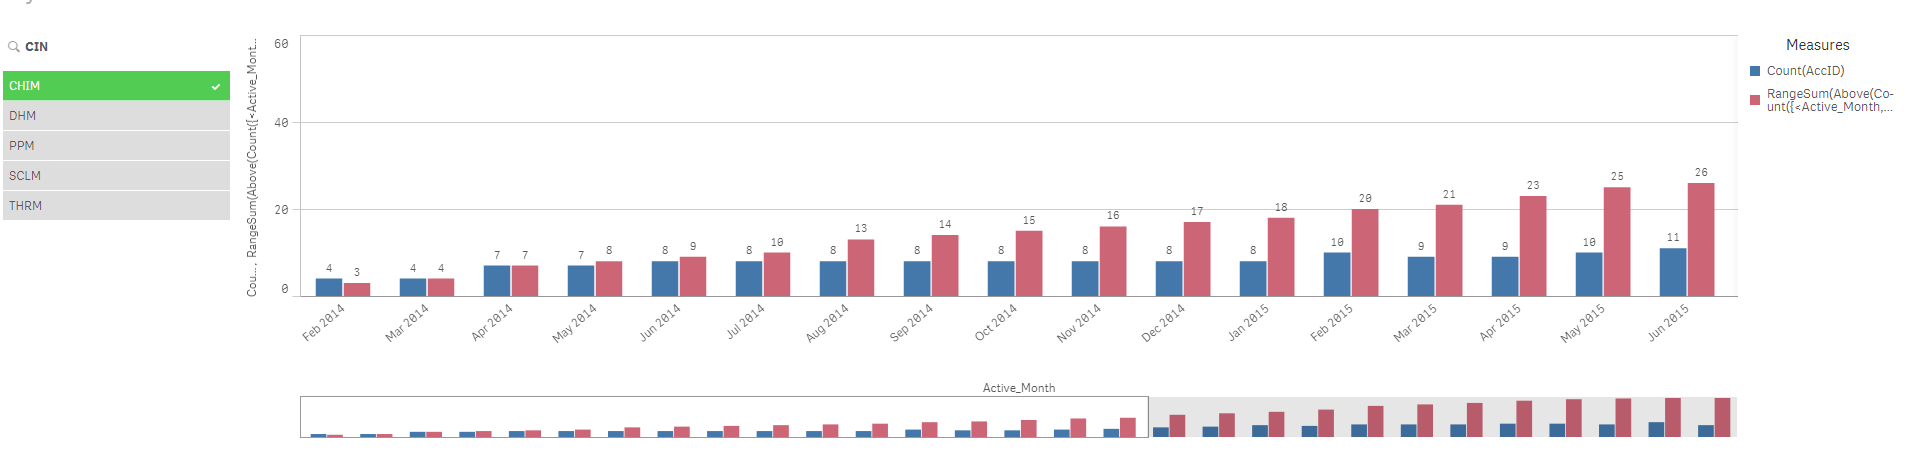
1st Snap:- Using the above formula, we can able to calculate the running total month on month basis.
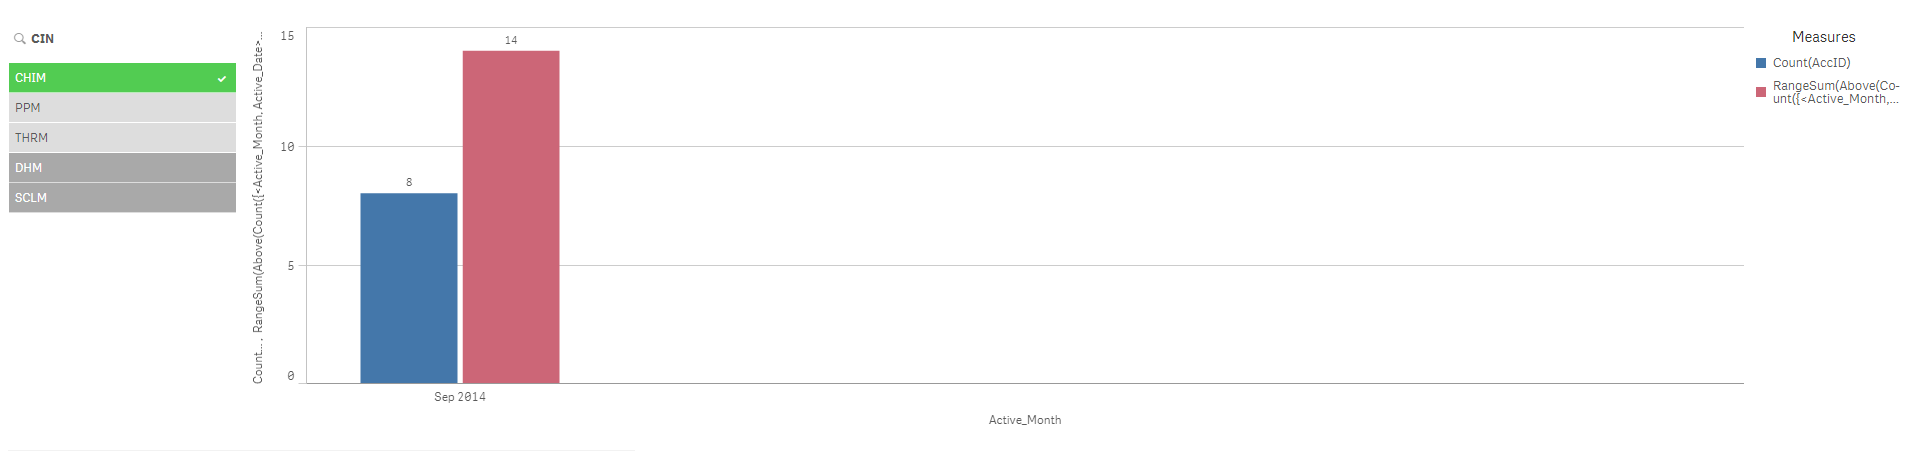
2nd Snap:- When I select the particular month, the running total fails and it shows only that month data.
Is there any way to resolve the data?
Please guide
- Mark as New
- Bookmark
- Subscribe
- Mute
- Subscribe to RSS Feed
- Permalink
- Report Inappropriate Content
Try this:
RangeSum(Above(Sum({<MonthYearField>} Sales), 0, RowNo())) * Avg(1)
- Mark as New
- Bookmark
- Subscribe
- Mute
- Subscribe to RSS Feed
- Permalink
- Report Inappropriate Content
Hello Sunny
I am using the below formula for running total. The dimension is Date which I convert in to Month using DATE(Active_date, 'YYYY-MM') formula
Running Total= RANGESUM(ABOVE(TOTAL COUNT(DISTINCT CLINICID), 0, ROWNO(TOTAL))).
But whenever I click on any particular month I shows the error. In the appended chain, I have attached my snaps.
I try to use the formula
RANGESUM(ABOVE(TOTAL COUNT({1}DISTINCT CLINICID), 0, ROWNO(TOTAL))).
The issue with that formula I am not able to filter out the Country & Region.
Please let me know if it makes sense.
Please guide
- Mark as New
- Bookmark
- Subscribe
- Mute
- Subscribe to RSS Feed
- Permalink
- Report Inappropriate Content
Try like this:
RANGESUM(ABOVE(TOTAL COUNT({1}DISTINCT CLINICID), 0, ROWNO(TOTAL))) * Avg(1)
or
RANGESUM(ABOVE(TOTAL COUNT({<Active_date>}DISTINCT CLINICID), 0, ROWNO(TOTAL))) * Avg(1)
- Mark as New
- Bookmark
- Subscribe
- Mute
- Subscribe to RSS Feed
- Permalink
- Report Inappropriate Content
Sir I have tried all the above formula.
RANGESUM(ABOVE(TOTAL COUNT({1}DISTINCT CLINICID), 0, ROWNO(TOTAL))) * Avg(1)
The issue with that formula is that it makes the table static. I want to filter the data via Country, Region & Market further.
But it does not move at all.
RANGESUM(ABOVE(TOTAL COUNT({<Active_date>}DISTINCT CLINICID), 0, ROWNO(TOTAL))) * Avg(1)
This gives me the same error while filter a particular month. It shows the running total of the particular month only
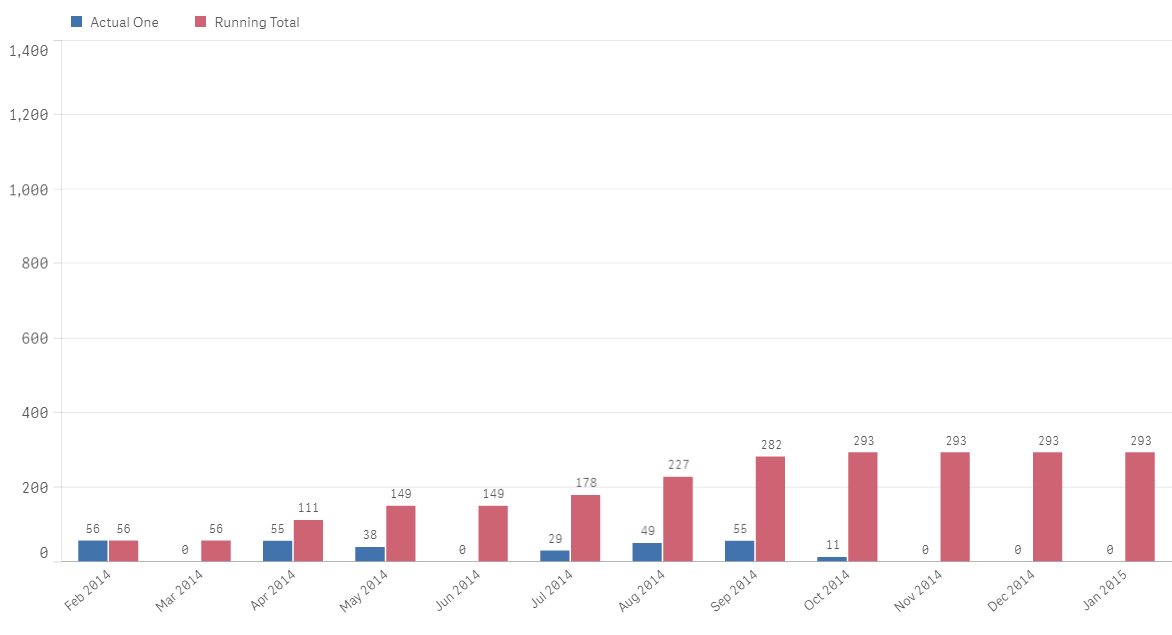
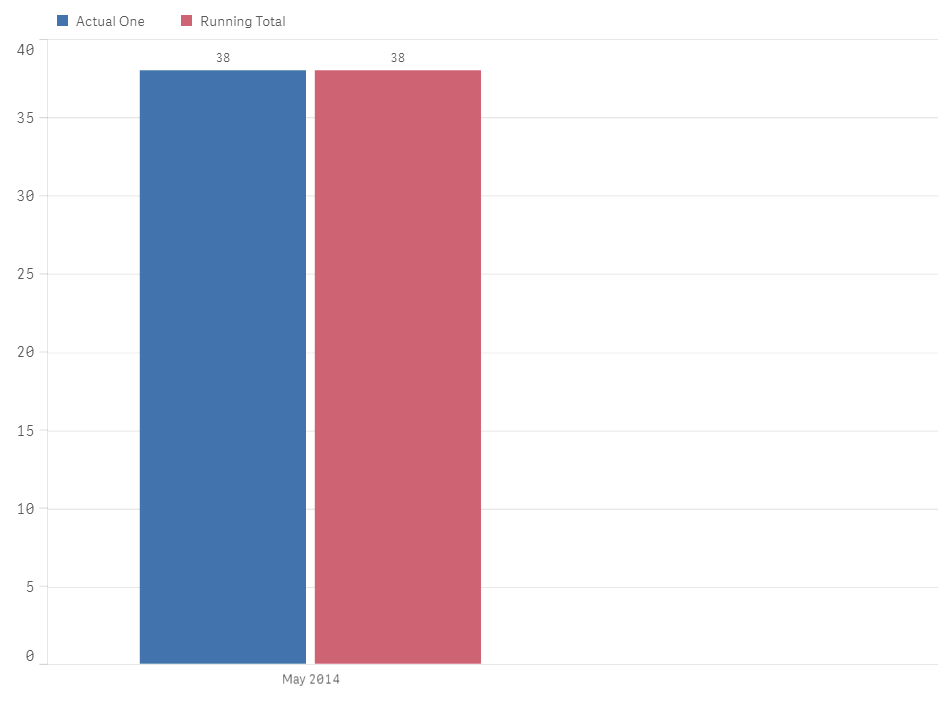
Just a background.. I have created a table whose dimension is Active Month ( Converting Active date to month) and attribute are Actual ID & Running total of Actual ID.
I want to filter the data via filter pane i.e. Country, Region & Market.
The main issue is selecting the particular month which can drill down on Country, Region & Market.
Please suggest
- « Previous Replies
- Next Replies »