Unlock a world of possibilities! Login now and discover the exclusive benefits awaiting you.
- Qlik Community
- :
- All Forums
- :
- QlikView App Dev
- :
- Re: forcing small data values that dont show up in...
- Subscribe to RSS Feed
- Mark Topic as New
- Mark Topic as Read
- Float this Topic for Current User
- Bookmark
- Subscribe
- Mute
- Printer Friendly Page
- Mark as New
- Bookmark
- Subscribe
- Mute
- Subscribe to RSS Feed
- Permalink
- Report Inappropriate Content
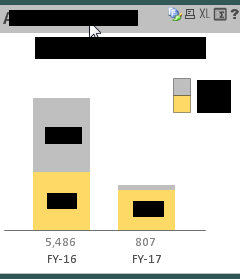
forcing small data values that dont show up in the bar chart
I have a bar chart where by clicking on Chart properties-->expressions-->values on data points, you can see all the values.
Although sometimes you wont see if the value is too small. eg: grey part of the bar chart for 2017 in the pic attached.
I know we can make it appear forcefully by adding formulae in presentation tab -->text in chart. I tried but it doesn't seem to give correct answer
My expressions and dimensions are as below:
I have below dimension and expressions in the chart properties for bar chart
Dimension: =if("Year" = 'FY-16' or "Year" = 'FY-17', "Fiscal Year")
expr = count(if(TYPE] = 'I' and [Job ] <> 'Direct', [REASON G]))/((count({< [TYPE],[TREASON],[REASON G] = >} (if([Job ]<> 'Direct', [EMPLID]))))/2)
I tried putting below in presentation tab -->text in chart . But doesnt work. basically doesnt give same value as it should give when you hover over the chart:
=num (
(
count(if([TYPE] = 'I' and [Job] <> 'Direct' and [Year] = 'FY-17', [REASON G]))
/
(count({< [TYPE],[TREASON],[REASON G] = >} (if([Job ]<> 'Direct', [EMPLID]))))/2
)
, '#,##0.00%'
)
Can someone help here?
- Tags:
- bar chart
- show values
- Mark as New
- Bookmark
- Subscribe
- Mute
- Subscribe to RSS Feed
- Permalink
- Report Inappropriate Content
Hi..Ria,
You can make a so-called Master Calendar that contains all the dates from min to max date. You generate this in your load script and it is a standard thing that is taught in QlikView classes and the subject of most QlikView books. QlikView Components even have a best-practice "component"/script-function to generate one for you:
https://community.qlik.com/thread/40043
There is a lot of information on this community if you search for Master Calendar - for instance this intro from Michael Tarallo:
- Mark as New
- Bookmark
- Subscribe
- Mute
- Subscribe to RSS Feed
- Permalink
- Report Inappropriate Content
HI ria,
You should aggregate the formula based on your dimension. try below one
Num (
Aggr(
(count(if([TYPE] = 'I' and [Job] <> 'Direct' and [Year] = 'FY-17', [REASON G]))
/
(count({< [TYPE],[TREASON],[REASON G] = >} (if([Job ]<> 'Direct', [EMPLID]))))/2 )
,"Fiscal Year")
, '#,##0.00%')
- Mark as New
- Bookmark
- Subscribe
- Mute
- Subscribe to RSS Feed
- Permalink
- Report Inappropriate Content
Hi Ria,
Please remember to mark this as "helpful" & "correct answer" If your problem has been resolved.
This will help users identify the answers should they come across this thread in the future.
Regard's
Sarvesh Srivastava