Unlock a world of possibilities! Login now and discover the exclusive benefits awaiting you.
- Qlik Community
- :
- All Forums
- :
- QlikView App Dev
- :
- AGGR() calculating wrong results
- Subscribe to RSS Feed
- Mark Topic as New
- Mark Topic as Read
- Float this Topic for Current User
- Bookmark
- Subscribe
- Mute
- Printer Friendly Page
- Mark as New
- Bookmark
- Subscribe
- Mute
- Subscribe to RSS Feed
- Permalink
- Report Inappropriate Content
AGGR() calculating wrong results
I used AGGR() to answer two questions from a dataset with 3.1 million rows and got inaccurate results. Also, the results change with different selections, when I would expect them to stay the same within a given dimension. The questions were: for each product, 1) what is the average premium per employee and 2) what is the medial premium per employee. It sounded like a good case for AGGR().
The application is too large to upload but here are screenshots. (When I reduce the application, all versions of the expressions start to provide the same result. It's only with the full data that I see these unexpected results.)
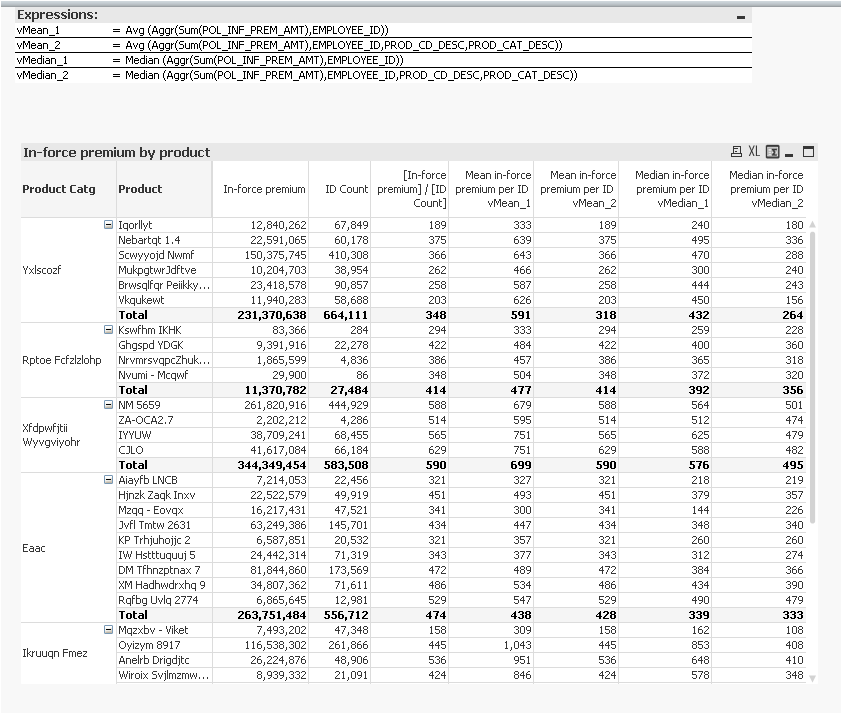
Note the expressions in the variable input box. The _1 version is what I used initially but gave wrong results. The _2 version gave the correct answer, but it requires that the expression include all the chart dimensions, which does not seem correct to me.
The first screenshot shows the average and median calculated various ways, with the expressions above in an input box. The correct MEAN amount is represented by the 3rd and 5th expression columns. The correct MEDIAN is shown in the final column. This is based on calculations provided separately by Excel.
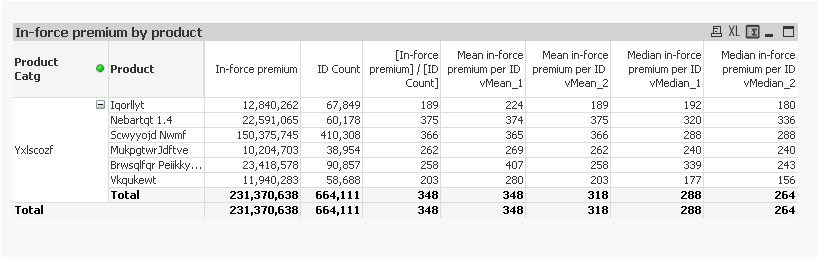
The second shows the result of selection the first value in Product Catg. Notice how the calculations using AGGR() changed from the no-selections version:
I really need to solve this, because AGGR() seemed quite promising for these kinds of calculations - if I can get it work correctly.
Accepted Solutions
- Mark as New
- Bookmark
- Subscribe
- Mute
- Subscribe to RSS Feed
- Permalink
- Report Inappropriate Content
With regards to your _2 statement about having to include all the columns. This is correct. By design, Aggr() ignores the chart dimensions. It is correct that you must list all dimensions to be used by aggr().
-Rob
- Mark as New
- Bookmark
- Subscribe
- Mute
- Subscribe to RSS Feed
- Permalink
- Report Inappropriate Content
Still no answer.
- Mark as New
- Bookmark
- Subscribe
- Mute
- Subscribe to RSS Feed
- Permalink
- Report Inappropriate Content
With regards to your _2 statement about having to include all the columns. This is correct. By design, Aggr() ignores the chart dimensions. It is correct that you must list all dimensions to be used by aggr().
-Rob
- Mark as New
- Bookmark
- Subscribe
- Mute
- Subscribe to RSS Feed
- Permalink
- Report Inappropriate Content
The difference is becasue the Product Category selection in the expression Vmedian_1 is respected
your expression is "Median(aggr(sum(x),employeeid))" so this will disregard the Dimension Product Category which
you have taken in the chart But if you select that dimension in the list box this Expression will be calculated
for that selection also . this is the reason for change in the result