Unlock a world of possibilities! Login now and discover the exclusive benefits awaiting you.
- Qlik Community
- :
- All Forums
- :
- QlikView App Dev
- :
- Price variance calculation with aggr and set analy...
- Subscribe to RSS Feed
- Mark Topic as New
- Mark Topic as Read
- Float this Topic for Current User
- Bookmark
- Subscribe
- Mute
- Printer Friendly Page
- Mark as New
- Bookmark
- Subscribe
- Mute
- Subscribe to RSS Feed
- Permalink
- Report Inappropriate Content
Price variance calculation with aggr and set analysis
Hello experts,
I'm struggling with the combination of aggr and set analysis.
Basicly, I want to implement a Price Variance Calculation,
which should work with the formula "Delta Price * original Qty".
On single lines (per product) it works fine, but the totals, especially if in per cent, are incorrect.
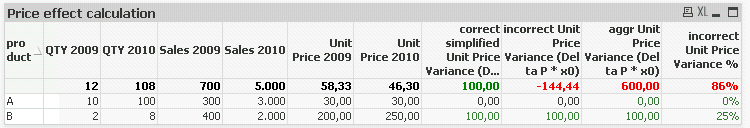
In the attached example the column "simplified unit price variance" shows the correct values, but won't work to show correct per centages,
because there I cannot use the sum(values) .
My attempt so use aggr was not succesful, the total is 600, but correct would be 100.
Any ideas/proposal are highly appreciated.
Daniel
__________________________________________
aggr_formula of: "incorrect Unit Price Variance %"
=
(
sum({$<year={$(=max(year))}>} aggr
(sum({$<year={$(=max(year))}>} Sales)
/sum({$<year={$(=max(year))}>} QTY)
, year, product))
- sum({$<year={$(=max(year)-1)}>} aggr
(sum({$<year={$(=max(year)-1)}>} Sales)
/sum({$<year={$(=max(year)-1)}>} QTY)
, year, product))
)
*sum({$<year={$(=max(year)-1)}>} aggr
(sum({$<year={$(=max(year)-1)}>} QTY)
, year, product))
/
sum({$<year={$(=max(year)-1)}>} Sales)
- Mark as New
- Bookmark
- Subscribe
- Mute
- Subscribe to RSS Feed
- Permalink
- Report Inappropriate Content
It is really helpfull example..
do you know how can i do it by date in insted of year?
thanks
AE
- Mark as New
- Bookmark
- Subscribe
- Mute
- Subscribe to RSS Feed
- Permalink
- Report Inappropriate Content
Well the reason the simplified version works is because you have the total mode set on "Sum of Rows" whereas in the incorrect version you have it set on "Expression Total". To be honest I really don't understand what you're trying to do so I can't really be more helpful but I don't think just summing the rows is really what you want (it works fine now because it's 100 and 0, but I have a feeling that it isn't going to do what you want in a different situation).
- Mark as New
- Bookmark
- Subscribe
- Mute
- Subscribe to RSS Feed
- Permalink
- Report Inappropriate Content
Trent, you are right, the "simplified" version works only for this example and cannot be used to calculate percentage variances.
The idea is to analyse sales variances over time. Basically, because sales = sales price * volume, the sales variance can be caused by price variances or volume variances. The tricky thing is, that both variances can have opposite signs (usually lower prices cause higher volumes, but does this lead to higher sales?)
- Mark as New
- Bookmark
- Subscribe
- Mute
- Subscribe to RSS Feed
- Permalink
- Report Inappropriate Content
I have been trying to do a very similar calculation and with your .qvw I was able to get it to work and wanted to share the equation I developed around the aggr function. When I created an expression with this calculation, I could even remove the "Product" dimension and it would still calculate correctly. Also, tested that if I wanted the key to be product-customer, I could just add a comma, after product and add Customer and that would work also. Rhonda
=Sum(aggr(
(sum({$<year={$(=max(year))}>} Sales)/sum({$<year={$(=max(year))}>} QTY)
-sum({$<year={$(=max(year)-1)}>} Sales)/sum({$<year={$(=max(year)-1)}>} QTY))
*sum({$<year={$(=max(year)-1)}>} QTY),product))