Unlock a world of possibilities! Login now and discover the exclusive benefits awaiting you.
- Qlik Community
- :
- All Forums
- :
- QlikView App Dev
- :
- Re: Line Chart, choose date, accumulative sum?
- Subscribe to RSS Feed
- Mark Topic as New
- Mark Topic as Read
- Float this Topic for Current User
- Bookmark
- Subscribe
- Mute
- Printer Friendly Page
- Mark as New
- Bookmark
- Subscribe
- Mute
- Subscribe to RSS Feed
- Permalink
- Report Inappropriate Content
Line Chart, choose date, accumulative sum?
Hello gurus.
I'm quite new to QlikView, and have some trouble with creating a line chart with accumulative values.
I've searched around, but either I suck at searching, or the answers and solutions I've tried haven't worked.
I'm creating a report regarding warehouse stock over time.
I have a data file giving me different movement types on products, quantities in/out date-wise (if you're familiar with SAP, it's the MB51-report).
Now, I want to have a line-chart that will give me total value of the stock on a selected date, and total quantities.
As this is a "balance", I need to sum from day one up to the selected date.
In a straight table, this expression does the trick, at least showing me the stock on a particular date;
Sum({<Date={"<=$(=max(Date))"}>} [Quantity])
But my line chart (using month/year as dimension) seems to sum the quantity movements each month instead of giving me the total quantity (= stock quantity).
Would anyone be helpful on this problem? 
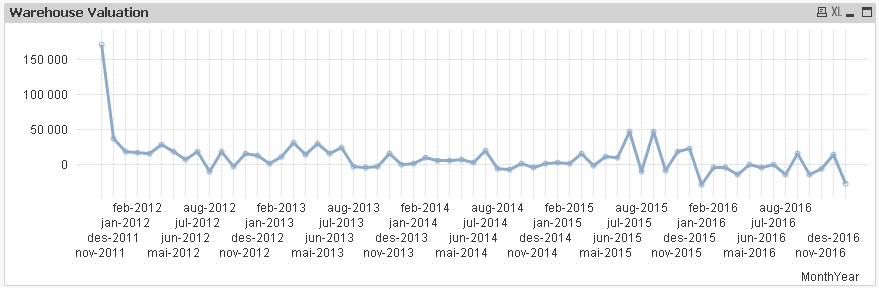
The in-going balance at the start in November 2011 shows a quantity of 171.000, and December 2011 shows 37.000.
But the stock quantity in December should be 171.000+37.000 = 208.000.
- « Previous Replies
-
- 1
- 2
- Next Replies »
- Mark as New
- Bookmark
- Subscribe
- Mute
- Subscribe to RSS Feed
- Permalink
- Report Inappropriate Content
Just for the try of it, I switched Quantity to Amount (value).
It's working with Amount, but not Quantity.
- Mark as New
- Bookmark
- Subscribe
- Mute
- Subscribe to RSS Feed
- Permalink
- Report Inappropriate Content
Ok, I'm sorry - my bad.
Quantity was supposed to be [Qty in Base Unit]. It's working now, thanks!
- Mark as New
- Bookmark
- Subscribe
- Mute
- Subscribe to RSS Feed
- Permalink
- Report Inappropriate Content
Not sure and difficult to say why 1 works, but the other one doesn't
- Mark as New
- Bookmark
- Subscribe
- Mute
- Subscribe to RSS Feed
- Permalink
- Report Inappropriate Content
Hahahaha
- « Previous Replies
-
- 1
- 2
- Next Replies »