Unlock a world of possibilities! Login now and discover the exclusive benefits awaiting you.
- Qlik Community
- :
- All Forums
- :
- QlikView App Dev
- :
- Re: QlikView Script - Rolling 12months
- Subscribe to RSS Feed
- Mark Topic as New
- Mark Topic as Read
- Float this Topic for Current User
- Bookmark
- Subscribe
- Mute
- Printer Friendly Page
- Mark as New
- Bookmark
- Subscribe
- Mute
- Subscribe to RSS Feed
- Permalink
- Report Inappropriate Content
QlikView Script - Rolling 12months
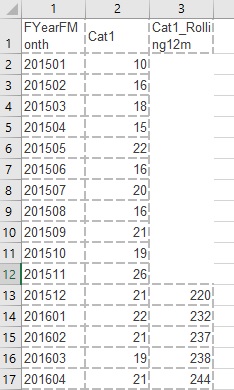
I am calculating a monthly count from a raw data table.
FYearFMonth | Cat1 |
201501 | 10 |
201502 | 16 |
201503 | 18 |
201504 | 15 |
201505 | 22 |
201506 | 16 |
201507 | 20 |
201508 | 16 |
201509 | 21 |
201510 | 19 |
201511 | 26 |
201512 | 21 |
201601 | 22 |
201602 | 21 |
201603 | 19 |
201604 | 21 |
201605 | 20 |
201606 | 22 |
201607 | 14 |
201608 | 18 |
201609 | 27 |
201610 | 14 |
201611 | 26 |
201612 | 23 |
201701 | 31 |
201702 | 33 |
201703 | 26 |
201704 | 20 |
201705 | 27 |
201706 | 23 |
201707 | 20 |
201708 | 27 |
In script, I now need to calculate a 12m moving average. I have been trying with RangeSum, above and i'm going in circles.
Please can someone give me a head start.
The outcome I need is like this;
FYearFMonth | Cat1 | Cat1_Rolling12m |
201501 | 10 | |
201502 | 16 | |
201503 | 18 | |
201504 | 15 | |
201505 | 22 | |
201506 | 16 | |
201507 | 20 | |
201508 | 16 | |
201509 | 21 | |
201510 | 19 | |
201511 | 26 | |
201512 | 21 | 220 |
201601 | 22 | 232 |
201602 | 21 | 237 |
201603 | 19 | 238 |
201604 | 21 | 244 |
201605 | 20 | 242 |
201606 | 22 | 248 |
201607 | 14 | 242 |
201608 | 18 | 244 |
201609 | 27 | 250 |
201610 | 14 | 245 |
201611 | 26 | 245 |
201612 | 23 | 247 |
201701 | 31 | 256 |
201702 | 33 | 268 |
201703 | 26 | 275 |
201704 | 20 | 274 |
201705 | 27 | 281 |
201706 | 23 | 282 |
201707 | 20 | 288 |
201708 | 27 | 297 |
Summary Scrip is like this;
RollingSum:
Load *,
RangeSum(peek(Cat1_Sum),Cat1) as Cat1_Sum; //-- Have been trying different options here
Load FYearFMonth,
count(Distinct [Incident ID]) as Cat1
Resident DataSummary where [Category]= '1' group by FYearFMonth order by FYearFMonth;
Thanks,
-Chris
Accepted Solutions
- Mark as New
- Bookmark
- Subscribe
- Mute
- Subscribe to RSS Feed
- Permalink
- Report Inappropriate Content
Hi Chris,
Maybe so?
Directory;
Table:
LOAD FYearFMonth,
Cat1,
RangeSum( Cat1, peek('Cat1_Sum')) as Cat1_Sum,
Cat1_Rolling12m,
If(ReCNo()<=12, 0, peek('Cat1', RecNo() - 13)) as Cat2
FROM
Book6.xlsx
(ooxml, embedded labels, table is Sheet1);
Left Join
LOAD*,
RangeSum( Cat2, peek('Cat2_Sum')) as Cat2_Sum,
Cat1_Sum - RangeSum( Cat2, peek('Cat2_Sum')) as Cat1_Rolling12m_Calc
Resident Table;
DROP Fields Cat1_Sum, Cat2, Cat2_Sum;
In the attached file data source
Result field "Cat1_Rolling12m_Calc"
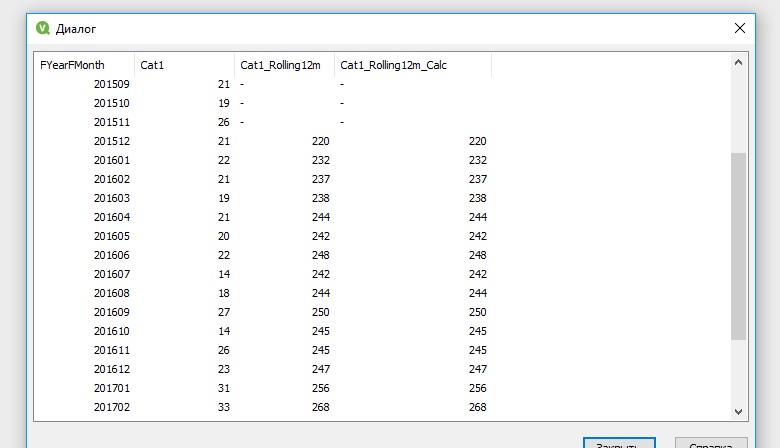
Regards,
Andrey
- Mark as New
- Bookmark
- Subscribe
- Mute
- Subscribe to RSS Feed
- Permalink
- Report Inappropriate Content
I think this posting will be helpful: Calculating rolling n-period totals, averages or other aggregations
- Marcus
- Mark as New
- Bookmark
- Subscribe
- Mute
- Subscribe to RSS Feed
- Permalink
- Report Inappropriate Content
Hi Chris,
Maybe so?
Directory;
Table:
LOAD FYearFMonth,
Cat1,
RangeSum( Cat1, peek('Cat1_Sum')) as Cat1_Sum,
Cat1_Rolling12m,
If(ReCNo()<=12, 0, peek('Cat1', RecNo() - 13)) as Cat2
FROM
Book6.xlsx
(ooxml, embedded labels, table is Sheet1);
Left Join
LOAD*,
RangeSum( Cat2, peek('Cat2_Sum')) as Cat2_Sum,
Cat1_Sum - RangeSum( Cat2, peek('Cat2_Sum')) as Cat1_Rolling12m_Calc
Resident Table;
DROP Fields Cat1_Sum, Cat2, Cat2_Sum;
In the attached file data source
Result field "Cat1_Rolling12m_Calc"
Regards,
Andrey
- Mark as New
- Bookmark
- Subscribe
- Mute
- Subscribe to RSS Feed
- Permalink
- Report Inappropriate Content
Hi Try This.
- Mark as New
- Bookmark
- Subscribe
- Mute
- Subscribe to RSS Feed
- Permalink
- Report Inappropriate Content
Fantastic - thank you!!