Unlock a world of possibilities! Login now and discover the exclusive benefits awaiting you.
- Qlik Community
- :
- Forums
- :
- Analytics
- :
- New to Qlik Analytics
- :
- Pie Chart with Trellis
Options
- Subscribe to RSS Feed
- Mark Topic as New
- Mark Topic as Read
- Float this Topic for Current User
- Bookmark
- Subscribe
- Mute
- Printer Friendly Page
Turn on suggestions
Auto-suggest helps you quickly narrow down your search results by suggesting possible matches as you type.
Showing results for
Anonymous
Not applicable
2017-02-27
09:05 AM
- Mark as New
- Bookmark
- Subscribe
- Mute
- Subscribe to RSS Feed
- Permalink
- Report Inappropriate Content
Pie Chart with Trellis
Hi All,
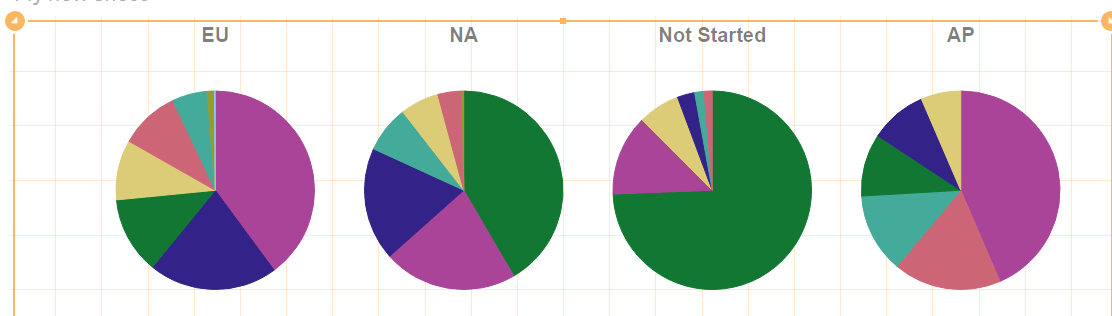
I have a requirement where I need to use pie chart with a trellis chart. I have used a trellis extension which I downloaded from Qlik branch. The issue I am facing is that I couldn't to find any option to show the values on data points which leaves me with just a series of pie charts with no labels or values to display. Kindly help me out.
Thanks in advance. 
320 Views
0 Replies
Community Browser