Unlock a world of possibilities! Login now and discover the exclusive benefits awaiting you.
- Qlik Community
- :
- Forums
- :
- Analytics
- :
- New to Qlik Analytics
- :
- Re: Qlik Sense Pivot Table Custom Row
- Subscribe to RSS Feed
- Mark Topic as New
- Mark Topic as Read
- Float this Topic for Current User
- Bookmark
- Subscribe
- Mute
- Printer Friendly Page
- Mark as New
- Bookmark
- Subscribe
- Mute
- Subscribe to RSS Feed
- Permalink
- Report Inappropriate Content
Qlik Sense Pivot Table Custom Row
Is it possible to include on the row of a Pivot Table the dimension plus the aggregate of one of the measures in a fact table.
Example:
InvoiceId, YearMonth, MonthSeq,Billed, Paid
1,201701,200,0,100
2,201701,100,0,50
3,201701,50,1,20
4,201702,300,0,100
Current Pivot Table (YearMonth , Paid)
YearMonth 0 1 ...
201701 150 20
201702 100
Need the following: (YearMonth Billed , Paid)
YearMonth / Billed 0 1 ...
201701 - 350 150 20
201702 - 300 100
Or better, would it be possible to add a single column just for the sum of billed for YearMonth ? I don't know if there is a way to include on rows since it is a measure that I am adding.
Accepted Solutions
- Mark as New
- Bookmark
- Subscribe
- Mute
- Subscribe to RSS Feed
- Permalink
- Report Inappropriate Content
To have this :
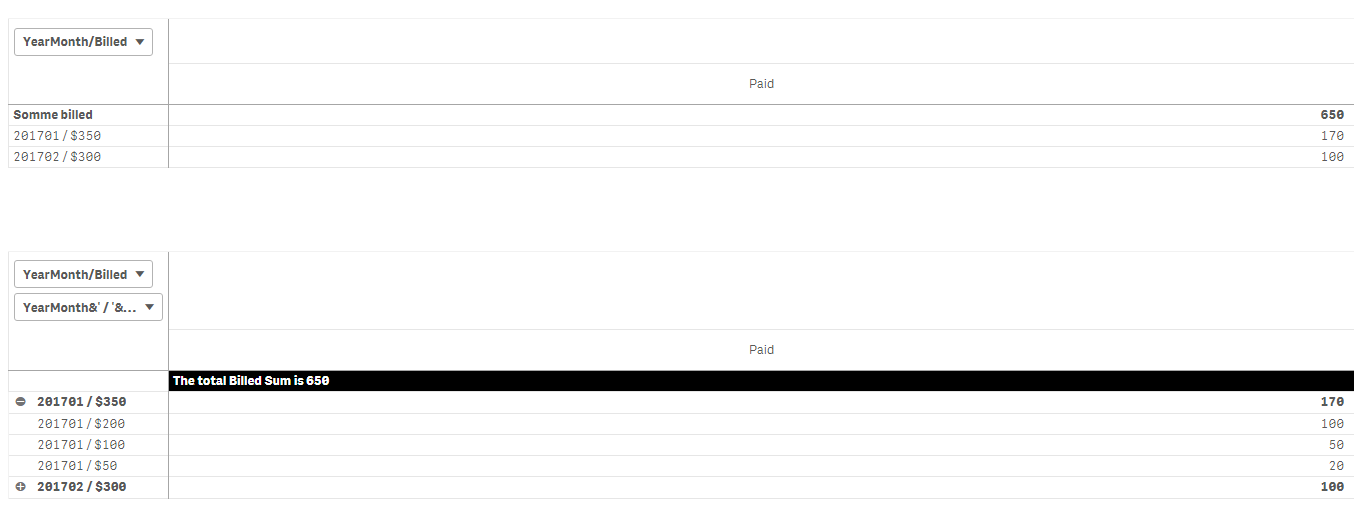
To achieve the first table:
1) As a dimension : =YearMonth&' / '&' $'&aggr(sum(Billed),YearMonth)
and activate total : leave its title as blank
2) as a measure: =IF(Dimensionality() = 0, 'The total Billed Sum is '&($(vSumBilled)), Sum(Paid))
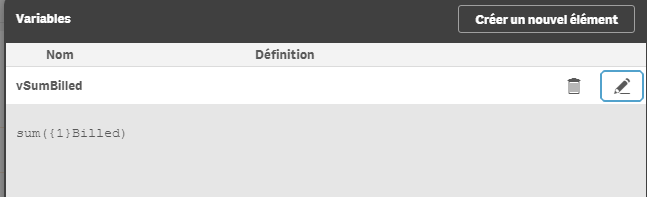
with vSumBilled = sum({1}Billed)
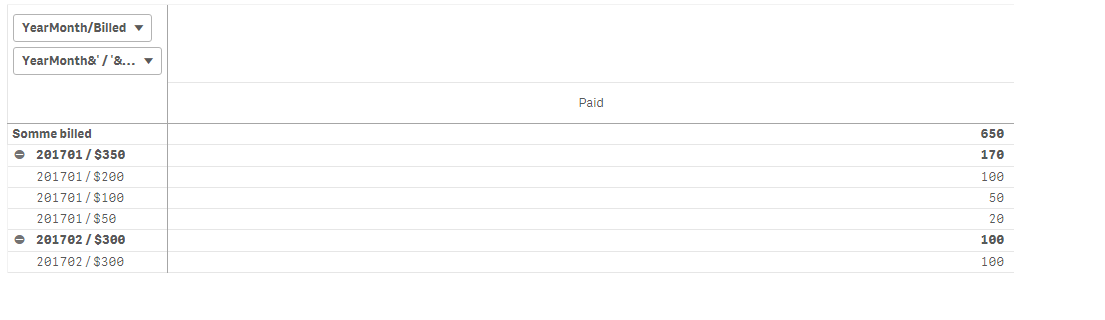
for the second table, you just add a second dimension :
=YearMonth&' / '&' $'&(Billed)
Hope this answers your question
- Mark as New
- Bookmark
- Subscribe
- Mute
- Subscribe to RSS Feed
- Permalink
- Report Inappropriate Content
Yes you can merge depending on what your expression is?
You can create a new dimension our of your measure but Aggr expression will not work in Script.
If you're anyhow able to modify your expression to create Billed as dimension then you can use
YearMonth&' - ' & Billed as [YearMonth Billed]
Which should give you the view you looking for.
BTW, what's your expression for Billed?
- Mark as New
- Bookmark
- Subscribe
- Mute
- Subscribe to RSS Feed
- Permalink
- Report Inappropriate Content
Billed=Sum(Billed), but better than my initial proposed concatenation (and probably a cleaner way) would be to keep the YearMonth dimension by itself on rows and add a new measure column (BilledAmount). However, the only way I know how to do iis to add to "columns", but that would replicate the billed values on all the columns and I only need it to show once, as a first column. Is there a way the Billed values could be displayed on a column by itself ?
- Mark as New
- Bookmark
- Subscribe
- Mute
- Subscribe to RSS Feed
- Permalink
- Report Inappropriate Content
Marco,
This is what I've done:
here's the table I'm working with :
load * Inline [
InvoiceId, YearMonth, MonthSeq,Billed, Paid
1,201701,200,0,100
2,201701,100,0,50
3,201701,50,1,20
4,201702,300,0,100
];
1) I've created a variable called vSumBilled= sum({1}Billed) to always get the total sum (billed) independant of the selections
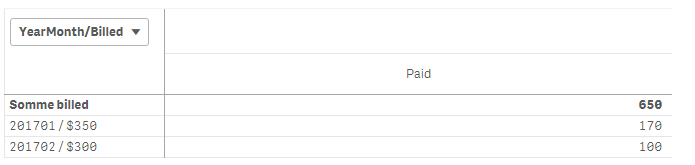
2) then, in the pivot table I've created a dimension like this:
=YearMonth&' / '&Billed (activate the total and name it Sum billed
3) The measure is like this:
=IF(Dimensionality() = 0, $(vSumBilled), Sum(Paid))
The result is as follows:

Hope this helps,
Omar,
- Mark as New
- Bookmark
- Subscribe
- Mute
- Subscribe to RSS Feed
- Permalink
- Report Inappropriate Content
Using your example sample data and detail above, the "Somme Billed" column would need to look like (one row per month):
Billed
201701 / $350
201702 / $300
On you example above you gave you are not aggregating the totals. Would need somehow the sum({1}BilledAmount) to be concatenated to the yearmonth on the dimension column..
- Mark as New
- Bookmark
- Subscribe
- Mute
- Subscribe to RSS Feed
- Permalink
- Report Inappropriate Content
Something like this?
Or even like this?
- Mark as New
- Bookmark
- Subscribe
- Mute
- Subscribe to RSS Feed
- Permalink
- Report Inappropriate Content
To have this :
To achieve the first table:
1) As a dimension : =YearMonth&' / '&' $'&aggr(sum(Billed),YearMonth)
and activate total : leave its title as blank
2) as a measure: =IF(Dimensionality() = 0, 'The total Billed Sum is '&($(vSumBilled)), Sum(Paid))
with vSumBilled = sum({1}Billed)
for the second table, you just add a second dimension :
=YearMonth&' / '&' $'&(Billed)
Hope this answers your question
- Mark as New
- Bookmark
- Subscribe
- Mute
- Subscribe to RSS Feed
- Permalink
- Report Inappropriate Content
This did the trick! Thanks a lot!