Unlock a world of possibilities! Login now and discover the exclusive benefits awaiting you.
- Qlik Community
- :
- Forums
- :
- Analytics
- :
- New to Qlik Analytics
- :
- How to create a Progress Bar chart in Qlik Sense??
- Subscribe to RSS Feed
- Mark Topic as New
- Mark Topic as Read
- Float this Topic for Current User
- Bookmark
- Subscribe
- Mute
- Printer Friendly Page
- Mark as New
- Bookmark
- Subscribe
- Mute
- Subscribe to RSS Feed
- Permalink
- Report Inappropriate Content
How to create a Progress Bar chart in Qlik Sense??
HI,
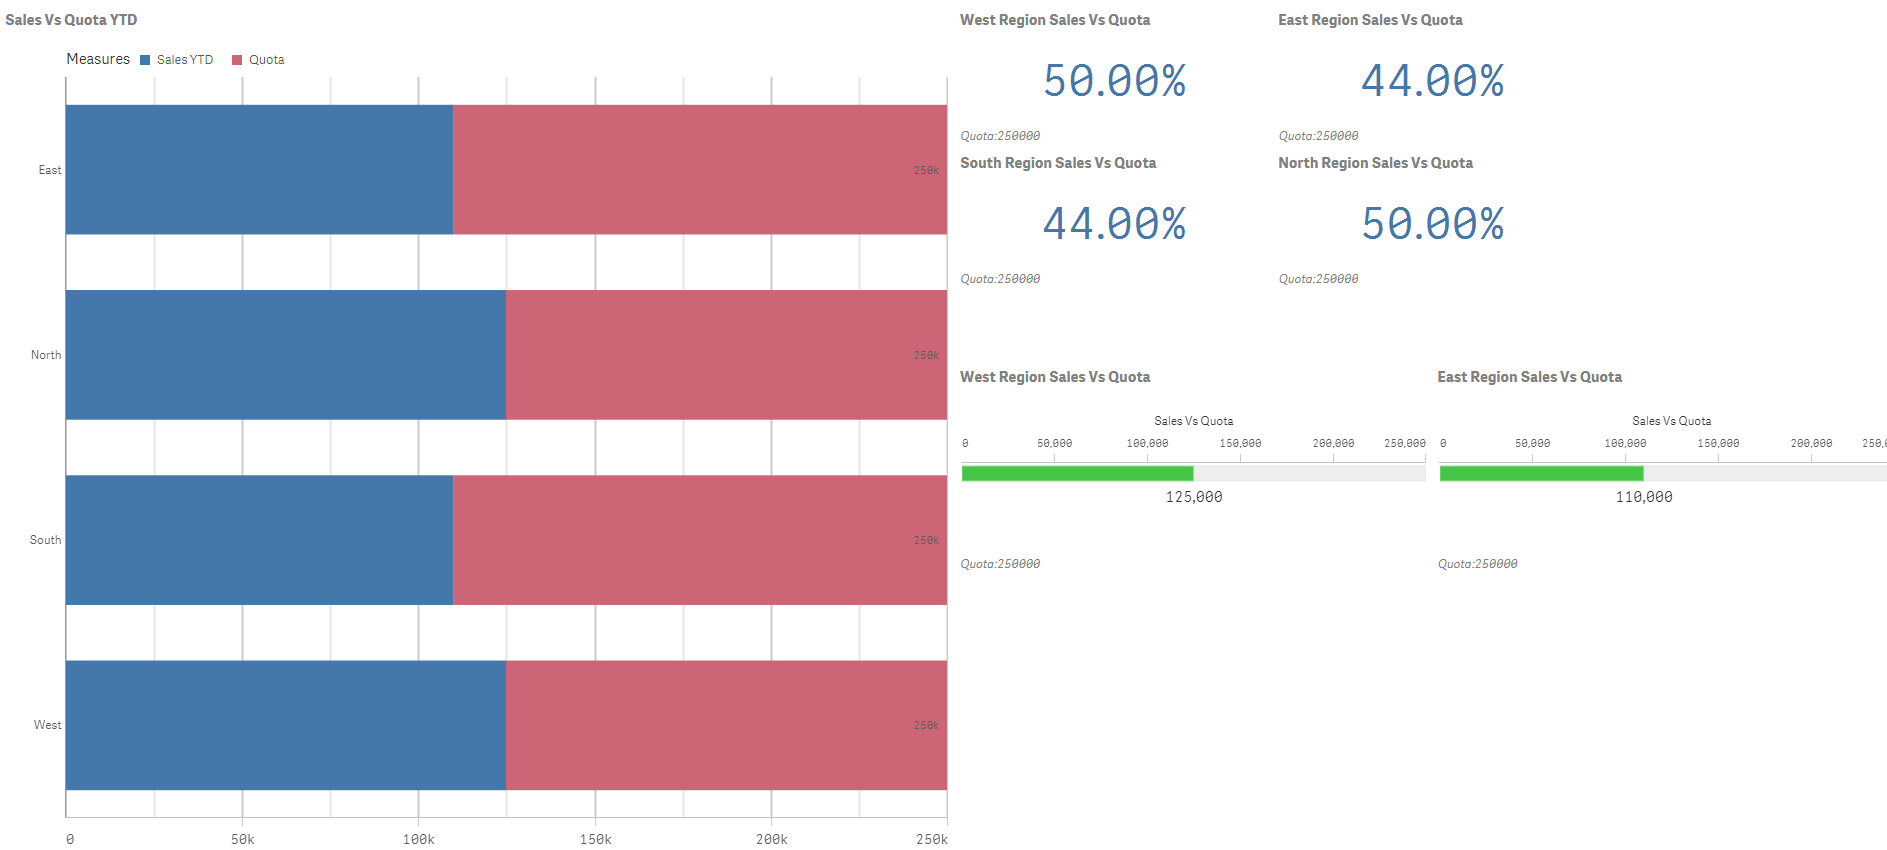
We have a requirement to create progress bar chart in Qlik Sense which will show Sales vs Quota. Is it possible in Qlik Sense?
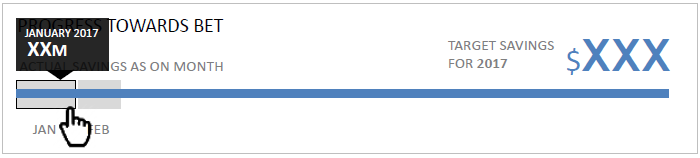
Please find the attached image.
Thanks
Anirban
- Mark as New
- Bookmark
- Subscribe
- Mute
- Subscribe to RSS Feed
- Permalink
- Report Inappropriate Content
Looks like a stacked bar chart would handle that requirement or perhaps a gauge chart would look good.
- Mark as New
- Bookmark
- Subscribe
- Mute
- Subscribe to RSS Feed
- Permalink
- Report Inappropriate Content
Hi Andy,
Thank you for replying.
Can you please let me know how we can achieve this.
- Mark as New
- Bookmark
- Subscribe
- Mute
- Subscribe to RSS Feed
- Permalink
- Report Inappropriate Content
Please find attached a few ideas of how you might visualise this requirement.
- Mark as New
- Bookmark
- Subscribe
- Mute
- Subscribe to RSS Feed
- Permalink
- Report Inappropriate Content
Hi Andy,
Thank you for Reply.
Is it possible to achieve attached wireframe using QlikSense.
- Mark as New
- Bookmark
- Subscribe
- Mute
- Subscribe to RSS Feed
- Permalink
- Report Inappropriate Content
Your call out and mouse is obscuring the context of your chart so no idea what you are trying to achieve.
If I ignore the styling and breakdown what you have
Chart title
Chart subtitle with target displayed
Measure title
Hover over to show achievement
Then you showed be able to use a gauge bar chart for this.
I'm unclear what the blue line actually represents or what you are measuring so you might want to be clearer on its use when you come to visualize it.