Unlock a world of possibilities! Login now and discover the exclusive benefits awaiting you.
- Qlik Community
- :
- Forums
- :
- Analytics
- :
- New to Qlik Analytics
- :
- Same metric different value..
- Subscribe to RSS Feed
- Mark Topic as New
- Mark Topic as Read
- Float this Topic for Current User
- Bookmark
- Subscribe
- Mute
- Printer Friendly Page
- Mark as New
- Bookmark
- Subscribe
- Mute
- Subscribe to RSS Feed
- Permalink
- Report Inappropriate Content
Same metric different value..
Hello
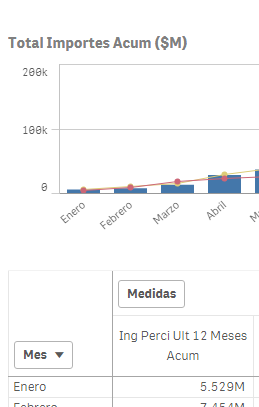
In my Dashboard in Sense I have a table with a metric and a bar graph with the same metric,
I want to get the result expressed in Millions for it I divide the metric by a million in the pivoting
table gives the correct result but in the graph of bars No,
I attached the chart below.
Enero Value 5,53K in bar chart
Enero value 5.529 M in Pivot Table.
Please Help..
- Mark as New
- Bookmark
- Subscribe
- Mute
- Subscribe to RSS Feed
- Permalink
- Report Inappropriate Content
Hi Debora,
The bar chart in the settings, select the expression in the "number format" element "Setup", and then in the space provided "sample format", add the required number of zeros after the decimal point. For example, # ##0,000 - for the accuracy of three decimal places.
Regards,
Andrey