Unlock a world of possibilities! Login now and discover the exclusive benefits awaiting you.
- Qlik Community
- :
- Forums
- :
- Analytics
- :
- New to Qlik Analytics
- :
- Re: Dynamic chart titles in Qlik Seense
- Subscribe to RSS Feed
- Mark Topic as New
- Mark Topic as Read
- Float this Topic for Current User
- Bookmark
- Subscribe
- Mute
- Printer Friendly Page
- Mark as New
- Bookmark
- Subscribe
- Mute
- Subscribe to RSS Feed
- Permalink
- Report Inappropriate Content
Dynamic chart titles in Qlik Seense
Hi,
As we know in QS 2.2 we can have alternative measures. can we get dynamic Chart title based on Measures?
Example: I am chart in below screenshot with sales as measure and volume as alternative measure.
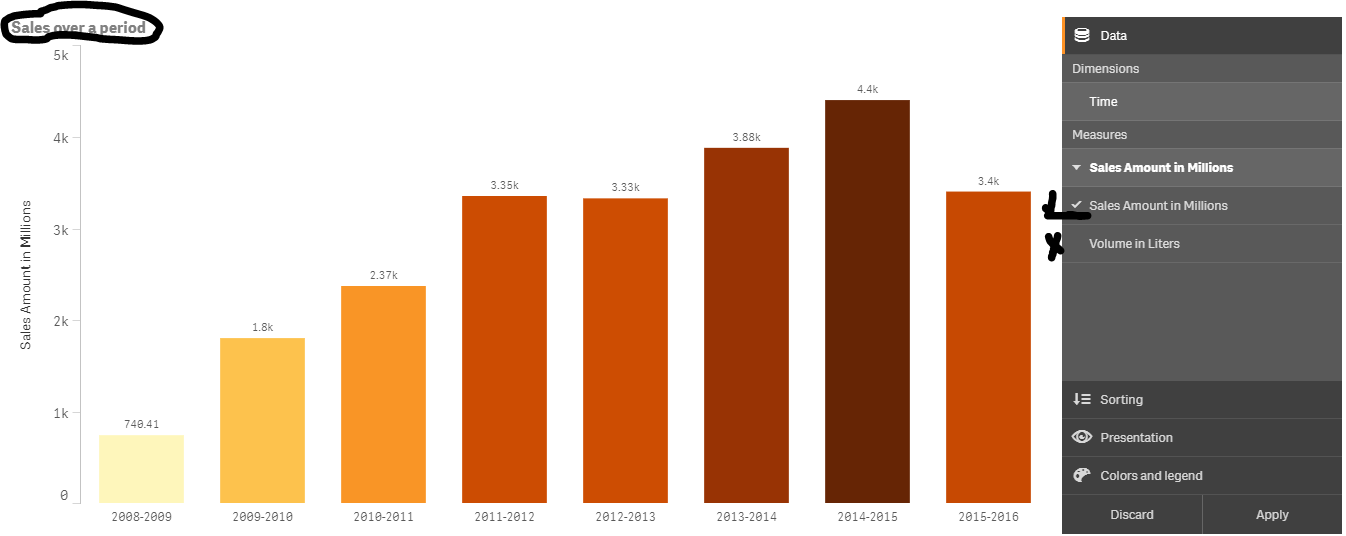
Question is my chart title says "Sales over a period", this title makes sense when user choose sales as measure but when user choose volume as measure I wish this title to change "Volume over a period". Any solution?
- Mark as New
- Bookmark
- Subscribe
- Mute
- Subscribe to RSS Feed
- Permalink
- Report Inappropriate Content
Hi
Currently at this point of time, we cannot dynamically change the labels in QlikSense. This is well possible in QlikView but in QS it is still not open.
Refer the below link for more info.
- Mark as New
- Bookmark
- Subscribe
- Mute
- Subscribe to RSS Feed
- Permalink
- Report Inappropriate Content
How do your users select the measure?
I have used a inline table to create a field that can be used in the title
refer Can we change the dimension of a bar chart with a parameter in qlik sense?
I added a title column to the inline table
DimensionSelector:
Load * inline
[
Selector, Name, Title
'a','NameA', 'A'
'b','NameB, 'B'
'c','NameC, 'C'
];
then used Title in the chart title

- Mark as New
- Bookmark
- Subscribe
- Mute
- Subscribe to RSS Feed
- Permalink
- Report Inappropriate Content
Thanks Bella,
Since it is advance method, let me test the method before hitting Correct Answer 
- Mark as New
- Bookmark
- Subscribe
- Mute
- Subscribe to RSS Feed
- Permalink
- Report Inappropriate Content
Hi Guruprem,
What you need here is Narrative Science extension . This will solve your issue check this link:
Narrative Science Demonstration using Qlik Sense - YouTube
You will acheive exactly what you are looking for.
Hope this helps.
Thanks,
Sangram.
- Mark as New
- Bookmark
- Subscribe
- Mute
- Subscribe to RSS Feed
- Permalink
- Report Inappropriate Content
Narrative Science did not work with alternate measures. When I switch between measures, the narrative extension says "Could not write a story because no Measures were specified. Please add at least one measure to the source chart or select a new chart."
- Mark as New
- Bookmark
- Subscribe
- Mute
- Subscribe to RSS Feed
- Permalink
- Report Inappropriate Content
I have a similar scenario which might help, but it is complicated. It also does not use the Exploration Menu.
We have a section where the users can select different measures - this should work the same for dimensions - where we use the QSVariable extension to let the user click on a button, which sets a variable value.
We then use this variable in the title and measures to make them dynamic, for example:
Title: if($(vMonthlyTrend) = 1, 'monthly trend', 'monthly change') & ' by Entity'
Measure:
if($(vMonthlyTrend) = 1,
<formula for trend>,
<formula for monthly change>
)
Note that we set the initial value of this variable in the load script.