Unlock a world of possibilities! Login now and discover the exclusive benefits awaiting you.
- Qlik Community
- :
- Forums
- :
- Analytics
- :
- New to Qlik Analytics
- :
- Re: Change of variable does not effect line chart
- Subscribe to RSS Feed
- Mark Topic as New
- Mark Topic as Read
- Float this Topic for Current User
- Bookmark
- Subscribe
- Mute
- Printer Friendly Page
- Mark as New
- Bookmark
- Subscribe
- Mute
- Subscribe to RSS Feed
- Permalink
- Report Inappropriate Content
Change of variable does not effect line chart
Hello Community,
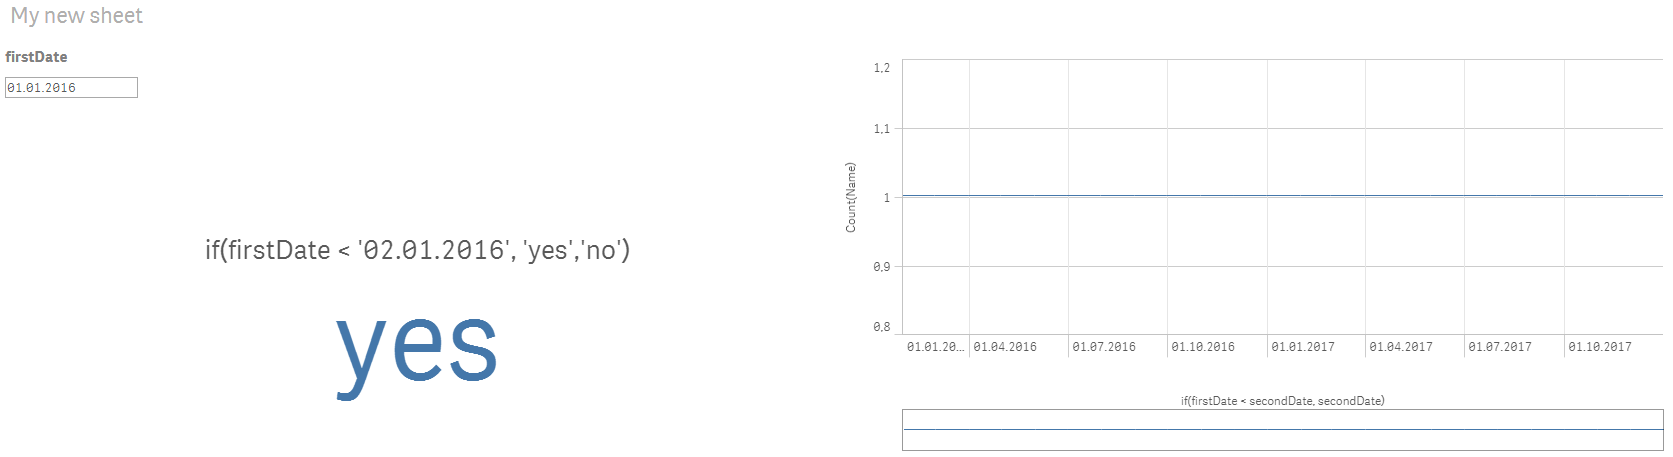
I have added a variable "firstDate" within a variable extension.
I have also created a line chart. The dimension of the line chart is "if(firstDate < secondDate, secondDate)". The measure is "count(name)".
I want this line chart to change if I change the variable, but it does not change.
Furthermore I have created a KPI wich shows if the "firstDate" is before the "secondDate", if I change the variable "firstDate" within the extension, the KPI displays the change.
Do you have any ideas why the line chart does not change any information?
Thank you for your help!
Accepted Solutions
- Mark as New
- Bookmark
- Subscribe
- Mute
- Subscribe to RSS Feed
- Permalink
- Report Inappropriate Content
Hi Florian,
Instead of creating a calculated dimension could you try to add the condition in the expression? Something like:
Count(If(firstDate < secondDate, name))
Regards,
H
- Mark as New
- Bookmark
- Subscribe
- Mute
- Subscribe to RSS Feed
- Permalink
- Report Inappropriate Content
Hi Florian,
Could you attach a sample? It seems that your code is correct...
Regards,
H
- Mark as New
- Bookmark
- Subscribe
- Mute
- Subscribe to RSS Feed
- Permalink
- Report Inappropriate Content
Hi Hector,
Here is a sample. I want the chart to start at 2017, if i change the variable to 01.01.2017.
The KPI changes if i change the variable, the chart not.
Thank you.
- Mark as New
- Bookmark
- Subscribe
- Mute
- Subscribe to RSS Feed
- Permalink
- Report Inappropriate Content
Hi Florian,
Instead of creating a calculated dimension could you try to add the condition in the expression? Something like:
Count(If(firstDate < secondDate, name))
Regards,
H
- Mark as New
- Bookmark
- Subscribe
- Mute
- Subscribe to RSS Feed
- Permalink
- Report Inappropriate Content
This works, and I had to set the dimension to just "secondDate"
And the measure to
Count(If(firstDate < secondDate, name))
Thank you for the help.