Unlock a world of possibilities! Login now and discover the exclusive benefits awaiting you.
- Qlik Community
- :
- Forums
- :
- Analytics
- :
- App Development
- :
- Re: How to hide something on chart?
- Subscribe to RSS Feed
- Mark Topic as New
- Mark Topic as Read
- Float this Topic for Current User
- Bookmark
- Subscribe
- Mute
- Printer Friendly Page
- Mark as New
- Bookmark
- Subscribe
- Mute
- Subscribe to RSS Feed
- Permalink
- Report Inappropriate Content
How to hide something on chart?
Hello, everyone!
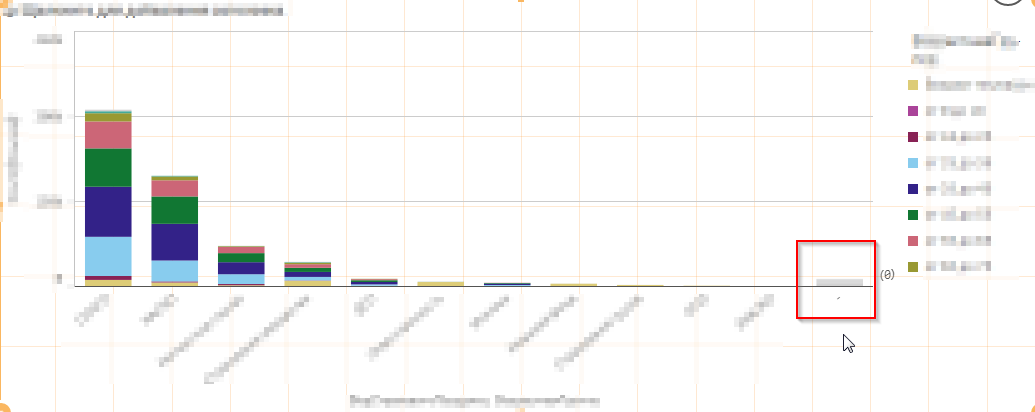
I got this chart and i make some script in visualization which must hide some positions (in red square)
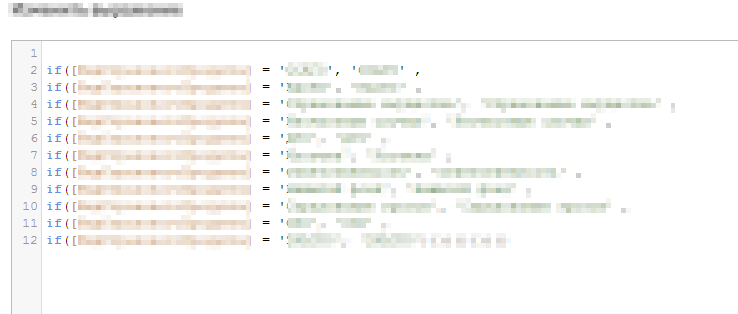
In script visualisation i write this in hope that it will hide
But i got this data (in red square) anyway...
Is there possible way to really hide some data on chart?
Accepted Solutions
- Mark as New
- Bookmark
- Subscribe
- Mute
- Subscribe to RSS Feed
- Permalink
- Report Inappropriate Content
in Dimension section uncheck Show Null Values
- Mark as New
- Bookmark
- Subscribe
- Mute
- Subscribe to RSS Feed
- Permalink
- Report Inappropriate Content
Hi Vasiliy,
It seems that you have null values for that dimension. In chart properties select "Dimension" tab and make sure that you have selected checkbox "Suppress when value is null" for calculated dimension you use in that chart. That should help.
BR,
Milosz
- Mark as New
- Bookmark
- Subscribe
- Mute
- Subscribe to RSS Feed
- Permalink
- Report Inappropriate Content
in Dimension section uncheck Show Null Values
- Mark as New
- Bookmark
- Subscribe
- Mute
- Subscribe to RSS Feed
- Permalink
- Report Inappropriate Content
am not sure but
uncheck show null values and unchk show others options
- Mark as New
- Bookmark
- Subscribe
- Mute
- Subscribe to RSS Feed
- Permalink
- Report Inappropriate Content
I'm sorry but my answer is related to QlikView, not Qlik Sense. But the solution is similar so you should find it under Dimension in Chart Properties.
BR,
Milosz