Unlock a world of possibilities! Login now and discover the exclusive benefits awaiting you.
- Qlik Community
- :
- Forums
- :
- Analytics
- :
- New to Qlik Analytics
- :
- Re: Vertical Reference Lines in Qlik Sense
- Subscribe to RSS Feed
- Mark Topic as New
- Mark Topic as Read
- Float this Topic for Current User
- Bookmark
- Subscribe
- Mute
- Printer Friendly Page
- Mark as New
- Bookmark
- Subscribe
- Mute
- Subscribe to RSS Feed
- Permalink
- Report Inappropriate Content
Vertical Reference Lines in Qlik Sense
I'm trying to add a vertical and horizontal reference line in Qlik Sense Line Chart object. Is there a way to do this? Also, is there a way to restrict the data that is shown on the x-axis? I have data that is indexed to time zero based on a monthsdifference calculation that I did, but there is some noise that gives negative values for month zero. Is there a way to have my chart only show values where the data is greater than month zero? The formula I'm currently using is as follows: count(DISTINCT [c_name]) / b_suites
- Mark as New
- Bookmark
- Subscribe
- Mute
- Subscribe to RSS Feed
- Permalink
- Report Inappropriate Content
Hi Ryan,
For the 1st part - Horizontal reference lines can be added from Add-Ons > Reference Lines > Add reference line and defining an expression for the value to be shown. This assumes that your measure is on Y axis. Given that I am not sure why you would add a vertical reference line since that would make a reference mark on the dimension axis.
For the restriction on what shows up on the x-axis use the limitation feature for the dimension.
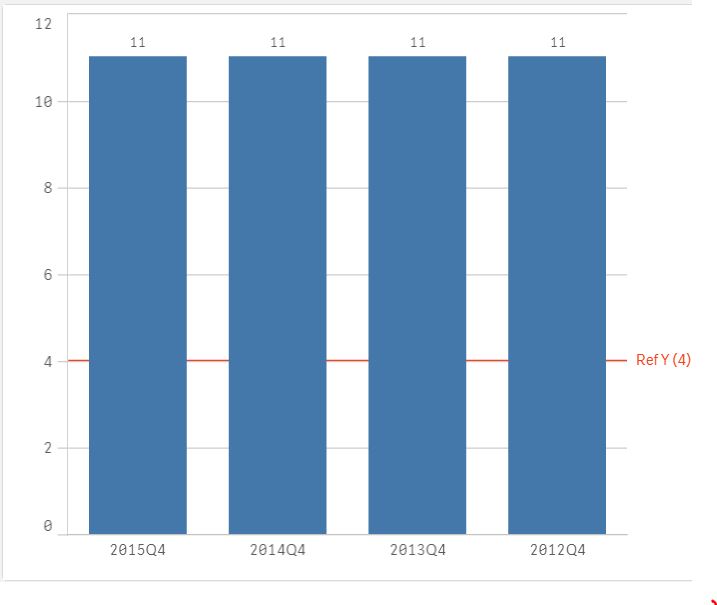
 This is without using any limitation
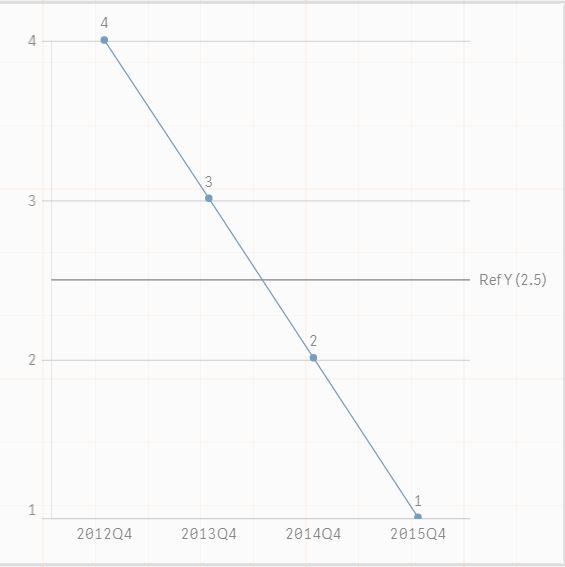
and this is using a limitation value of 2 on the measure - which stops the last two quarters from showing up on the X axis

You can select if you want to show the Others or leave it out.
Is this what you are looking for - if yes, hope this helps. If not, maybe could you share a picture of your chart to show the problem.
Thanks,
Ajit