Unlock a world of possibilities! Login now and discover the exclusive benefits awaiting you.
- Qlik Community
- :
- All Forums
- :
- QlikView App Dev
- :
- Re: expression problem
- Subscribe to RSS Feed
- Mark Topic as New
- Mark Topic as Read
- Float this Topic for Current User
- Bookmark
- Subscribe
- Mute
- Printer Friendly Page
- Mark as New
- Bookmark
- Subscribe
- Mute
- Subscribe to RSS Feed
- Permalink
- Report Inappropriate Content
expression problem
hi there,
i am struggling with a chart expression.given the following chart:
| Month | Year | Revenue | Cumulated Revenue | COMMENT |
|---|---|---|---|---|
| JAN | 2015 | 100 | 100 | =JAN |
| JAN | 2016 | 50 | 50 | =JAN |
| JAN | 2017 | 200 | 200 | =JAN |
| FEB | 2015 | 20 | 120 | =JAN+FEB |
| FEB | 2016 | 200 | 250 | =JAN+FEB |
| FEB | 2017 | 10 | 210 | =JAN+FEB |
| MAR | 2015 | 60 | 180 | =JAN+FEB+MAR |
| MAR | 2016 | 20 | 270 | =JAN+FEB+MAR |
| MAR | 2017 | 50 | 260 | =JAN+FEB+MAR |
what i want is aggergate every month's revenue + the previous month's revenue for every year --> column [CUMULATED REVENUE]
any help how i can do this ?
thanks a lot!
- Mark as New
- Bookmark
- Subscribe
- Mute
- Subscribe to RSS Feed
- Permalink
- Report Inappropriate Content
May be like this
Aggr(RangeSum(Above(Sum(Revenue), 0, RowNo())), Year, Month)
- Mark as New
- Bookmark
- Subscribe
- Mute
- Subscribe to RSS Feed
- Permalink
- Report Inappropriate Content
Maybe use an AsOf table like shown in
- Mark as New
- Bookmark
- Subscribe
- Mute
- Subscribe to RSS Feed
- Permalink
- Report Inappropriate Content
Thanks. But I should say that i cant / dont want to modify the script....
- Mark as New
- Bookmark
- Subscribe
- Mute
- Subscribe to RSS Feed
- Permalink
- Report Inappropriate Content
Then use something like Sunny suggested or something like described here:
Calculating rolling n-period totals, averages or other aggregations
If you go for the Aggr() solution, take care that your Month show chronological load order or use the sorted aggr() dimensions:
- Mark as New
- Bookmark
- Subscribe
- Mute
- Subscribe to RSS Feed
- Permalink
- Report Inappropriate Content
Here is a sample attached
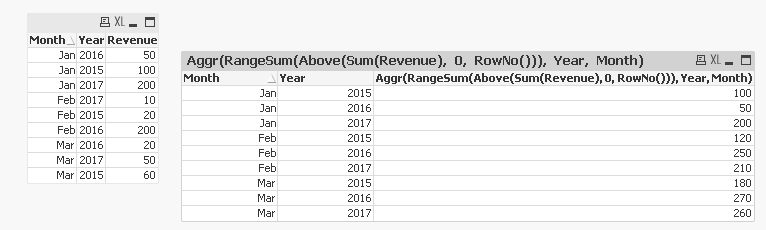
But like Stefan mentioned, this solution assumes that your Month field is sorted in the ascending order in the script. If it isn't you will either need to sort this in the script or you can use The sortable Aggr function is finally here! in QV12 or above. The syntax would look like this
Aggr(RangeSum(Above(Sum(Revenue), 0, RowNo())), Year, (Month,(NUMERIC)))
- Mark as New
- Bookmark
- Subscribe
- Mute
- Subscribe to RSS Feed
- Permalink
- Report Inappropriate Content
Check the attachment