Unlock a world of possibilities! Login now and discover the exclusive benefits awaiting you.
- Qlik Community
- :
- All Forums
- :
- QlikView App Dev
- :
- Re: How to display a graph when element(s) in the ...
- Subscribe to RSS Feed
- Mark Topic as New
- Mark Topic as Read
- Float this Topic for Current User
- Bookmark
- Subscribe
- Mute
- Printer Friendly Page
- Mark as New
- Bookmark
- Subscribe
- Mute
- Subscribe to RSS Feed
- Permalink
- Report Inappropriate Content
How to display a graph when element(s) in the selection list are selected?
Hello,
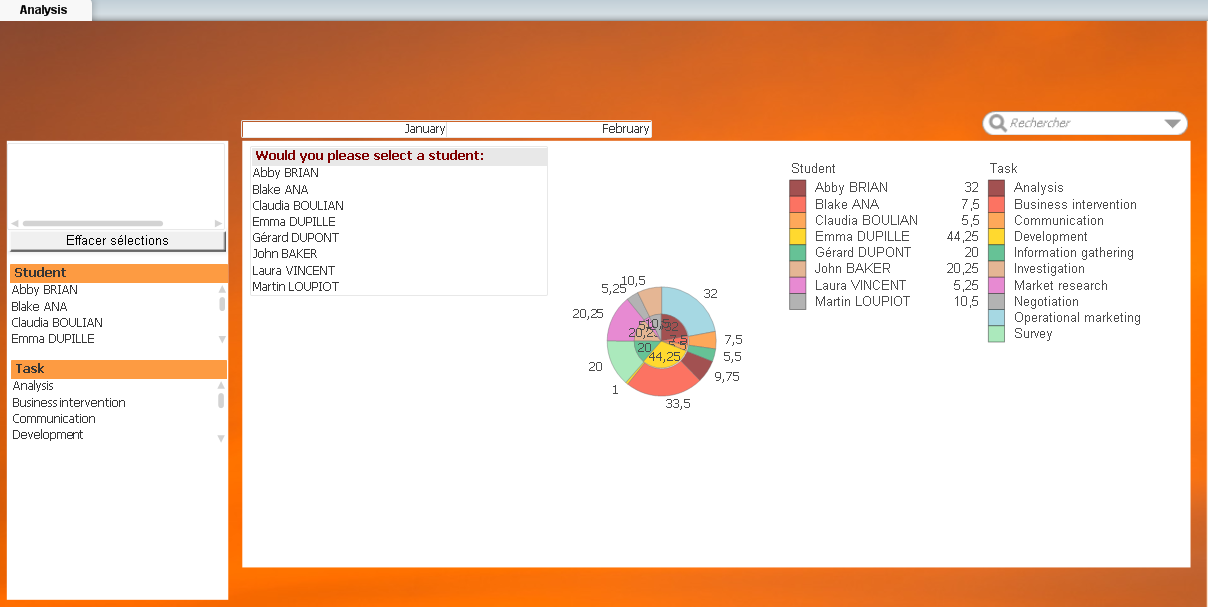
I have to use a graph with two attributes (students and tasks) and a calculated dimension (time of attendance).
I'll be interested for the analysis for only one student to see the different times per task.
How can be possible to display the graph only when one or more students were selected in the selection list?
Thank you in advance for your help.
- Mark as New
- Bookmark
- Subscribe
- Mute
- Subscribe to RSS Feed
- Permalink
- Report Inappropriate Content
Hi,
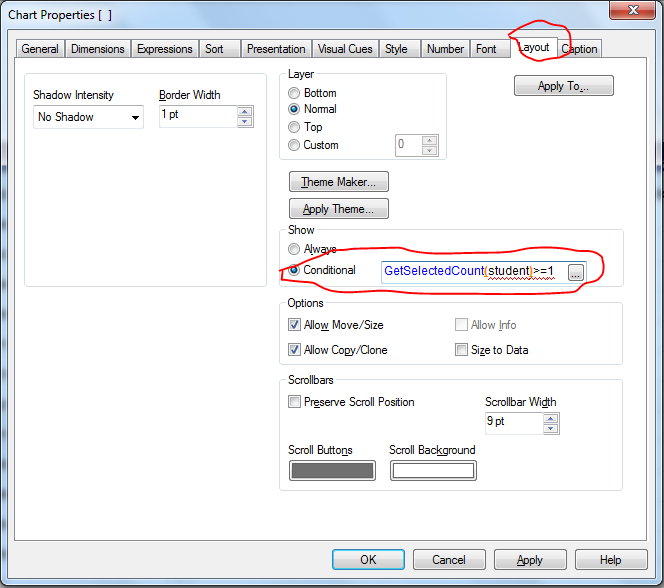
You can use GetSelectedCount(student)>=1 function. see in help menu for details.
Thanks & Regards,
Neha
- Mark as New
- Bookmark
- Subscribe
- Mute
- Subscribe to RSS Feed
- Permalink
- Report Inappropriate Content
Add this condition in layout tab in condition section.
- Mark as New
- Bookmark
- Subscribe
- Mute
- Subscribe to RSS Feed
- Permalink
- Report Inappropriate Content
Thank you for your answer but it doesn't work.
The graph is still activated when no items are selected in the selection list
- Mark as New
- Bookmark
- Subscribe
- Mute
- Subscribe to RSS Feed
- Permalink
- Report Inappropriate Content
Hi,
Can you put sample data?
And for reference please find attached file.
Thanks,
Neha
- Mark as New
- Bookmark
- Subscribe
- Mute
- Subscribe to RSS Feed
- Permalink
- Report Inappropriate Content
I think that i only can send you pictures in this discussion.
I hope their can help you !