Unlock a world of possibilities! Login now and discover the exclusive benefits awaiting you.
- Qlik Community
- :
- All Forums
- :
- QlikView App Dev
- :
- Has anyone created Gantt Chart using QV10 Personal...
- Subscribe to RSS Feed
- Mark Topic as New
- Mark Topic as Read
- Float this Topic for Current User
- Bookmark
- Subscribe
- Mute
- Printer Friendly Page
- Mark as New
- Bookmark
- Subscribe
- Mute
- Subscribe to RSS Feed
- Permalink
- Report Inappropriate Content
Has anyone created Gantt Chart using QV10 Personal Edition?
Hi All
Has any one created "Gantt Chart" using QV10 Personal Edition. If you have done it please let me know the steps to create the same please.
- « Previous Replies
-
- 1
- 2
- Next Replies »
- Mark as New
- Bookmark
- Subscribe
- Mute
- Subscribe to RSS Feed
- Permalink
- Report Inappropriate Content
Hi Sander,
Most of the manipulation for the Gantt Chart i.e. date format and date period grouping, can be found in the java script file for the extension. The location for the file is something like
C:\Users\{username}\AppData\Local\QlikTech\QlikView\Extensions\Objects\Gantt\Script.js
You need to have an understanding of how Java Script works though.
I hope this helps.
Regards,
Siz.
- Mark as New
- Bookmark
- Subscribe
- Mute
- Subscribe to RSS Feed
- Permalink
- Report Inappropriate Content
To change the date format, simply update the variable chartDateFormat in the Script.js file
var chartDateFormat = "dd/mm/yyyy";
// date format of the dates that are used in the chart. for example, European format would be dd/mm/yyyy
Please bear in mind that the input dates in the load script need to remain in the American format.
e.g.
LOAD "Campaign Group",
Campaign,
DATE("Start Date",'MM/DD/YYYY') AS [Start Date],
DATE("End Date",'MM/DD/YYYY') AS [End Date];
SQL SELECT *
FROM Demo.dbo.DimCampaign2;
I hope this helps.
Regards,
Siz.
- Mark as New
- Bookmark
- Subscribe
- Mute
- Subscribe to RSS Feed
- Permalink
- Report Inappropriate Content
Hi Siz,
Thanks for your explanation. I didn't know javascript was under the hood of these extensions. Works fine with the date format now. I'll have to take a deeper look into javascript coding for more changes in the extension script.
Regards, Sander
- Mark as New
- Bookmark
- Subscribe
- Mute
- Subscribe to RSS Feed
- Permalink
- Report Inappropriate Content
Great Sander,
If you do something interesting with the javascript please could you let us know what and how on this post as there is good potential with this extension.
Regards,
Siz.
- Mark as New
- Bookmark
- Subscribe
- Mute
- Subscribe to RSS Feed
- Permalink
- Report Inappropriate Content
Hi,
I'm having trouble changing the date format of the Gantt Extension. When using the default 'mm/dd/yyyy' format in the Script.js file the chart appears correctly. However when I change the chartDateFormat variable to 'dd/mm/yyyy' and reopen the qvw, the bars on the chart now display incorrectly and the dates still appear in the 'mm/dd/yyyy' format when I hover over them.
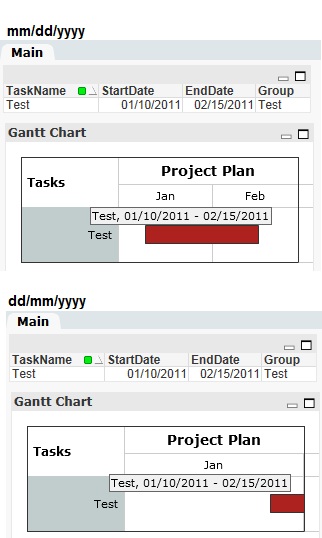
I'm leaving the input dates in the load script in the 'mm/dd/yyyy' format as you suggested. I've also tried changing this to the 'dd/mm/yyyy' but when I tried this the chart fails to load. The only change I made was to the chartDateFormat variable, am I doing something wrong?
Ideally I'd want to have the dates displayed in the following format: 'dd mmm yyyy' e.g. '18 Jan 2012'. Is this possible?
Thanks,
Tom
- « Previous Replies
-
- 1
- 2
- Next Replies »