Unlock a world of possibilities! Login now and discover the exclusive benefits awaiting you.
- Qlik Community
- :
- Forums
- :
- Analytics
- :
- New to Qlik Analytics
- :
- Re: switching between measures
- Subscribe to RSS Feed
- Mark Topic as New
- Mark Topic as Read
- Float this Topic for Current User
- Bookmark
- Subscribe
- Mute
- Printer Friendly Page
- Mark as New
- Bookmark
- Subscribe
- Mute
- Subscribe to RSS Feed
- Permalink
- Report Inappropriate Content
switching between measures
Is there a quicker/more user friendly way to change to alternative measures in Qlik Sense rather than going through the exploration menu?
Thanks,
Nick
- Mark as New
- Bookmark
- Subscribe
- Mute
- Subscribe to RSS Feed
- Permalink
- Report Inappropriate Content
Suppose I have 3 measures:
sum(CA)
sum(Quantity)
sum(Marge)
And I want to have all 3 measures in the same graphic.
You can add them as alternative measures as you're doing.
ANother way is to create an inline table in the script:
Let's call it:
Measures:
load * inline [
Measure
CA
QUANTITY
MARGE
];
Now, in our graphic we only have to use one measure:
sum(if(Measure='CA',
CA,
if(Measure='QUANTITY',
[Quantité] ,
if(Measure='MARGE',
Marge ))))
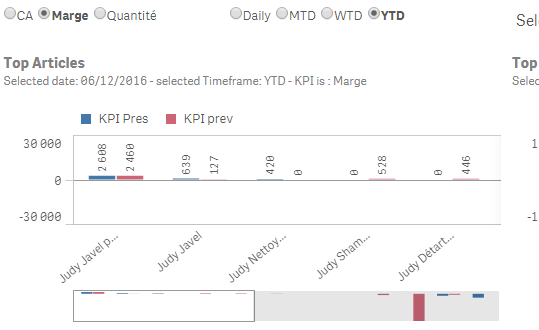
Add the new created field Measure as a filter object, and when you select a value, your measure will change with your selection:
Example:
I select CA: I get sum(CA) as a measure in my bar chart
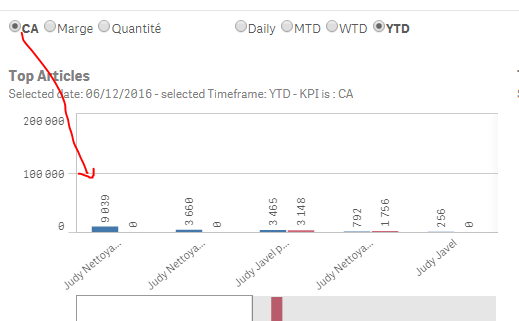
I select Marge:(I get sum(marge) as a measure of my bar chart
Hope this helps
- Mark as New
- Bookmark
- Subscribe
- Mute
- Subscribe to RSS Feed
- Permalink
- Report Inappropriate Content
Hi Omar,
Thanks for the reply, I will give this a try on Monday.
This may be a stupid question but how do you get the filter object to show the selection dots as you have above?
Thanks,
Nick
- Mark as New
- Bookmark
- Subscribe
- Mute
- Subscribe to RSS Feed
- Permalink
- Report Inappropriate Content
It's an extension object; you'll find it attached.
To use an extension,
please put it under:
C:\Users\yourUser\Documents\Qlik\Sense\Extensions
then unzip it.
- Mark as New
- Bookmark
- Subscribe
- Mute
- Subscribe to RSS Feed
- Permalink
- Report Inappropriate Content
This is the easiest method i figured for myself. You create alternative measures and choose to display 'Labels and Title' in the Appearance section. One the sheet the toggle shows on the axis title (last screenshot)
