Unlock a world of possibilities! Login now and discover the exclusive benefits awaiting you.
- Qlik Community
- :
- Forums
- :
- Analytics
- :
- New to Qlik Analytics
- :
- Re: Selections and pie chart: show among all and a...
- Subscribe to RSS Feed
- Mark Topic as New
- Mark Topic as Read
- Float this Topic for Current User
- Bookmark
- Subscribe
- Mute
- Printer Friendly Page
- Mark as New
- Bookmark
- Subscribe
- Mute
- Subscribe to RSS Feed
- Permalink
- Report Inappropriate Content
Selections and pie chart: show among all and among selection
Hi all!
I want to show a client position in all benchmark data, and also - in his/her industry.
What I have:
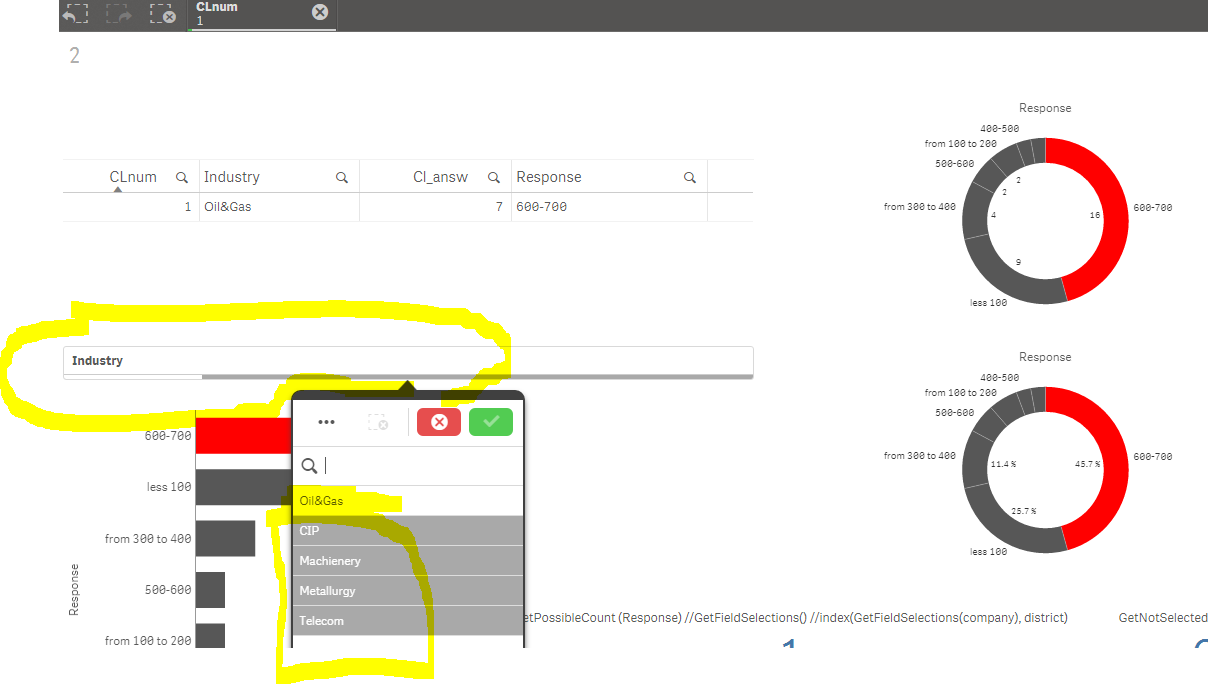
When I select a client (CLnum) in filter - I see pie chart colored where he relates to.
I use {1} in count() formula in order to leave all the data in pie chart.
I need to implement a Industry filter.
And If I also select an Industry - I need the data in pie chart show only the numbers of industry selected.
Now when I select the industry - it changes nothing on pie chart because I use {1} in formula....
How to do it?
See the attached file...
Accepted Solutions
- Mark as New
- Bookmark
- Subscribe
- Mute
- Subscribe to RSS Feed
- Permalink
- Report Inappropriate Content
Like this?
See the attached app:
New measure: Count({<Response=,Cl_answ=,CLnum=>}Response)
- Mark as New
- Bookmark
- Subscribe
- Mute
- Subscribe to RSS Feed
- Permalink
- Report Inappropriate Content
Can you share sampe data or a .qvf??
- Mark as New
- Bookmark
- Subscribe
- Mute
- Subscribe to RSS Feed
- Permalink
- Report Inappropriate Content
Like this?
See the attached app:
New measure: Count({<Response=,Cl_answ=,CLnum=>}Response)
- Mark as New
- Bookmark
- Subscribe
- Mute
- Subscribe to RSS Feed
- Permalink
- Report Inappropriate Content
Exactly!
What does this measure mean? (please give a link to description )
You state nothing after equation sign 0-0
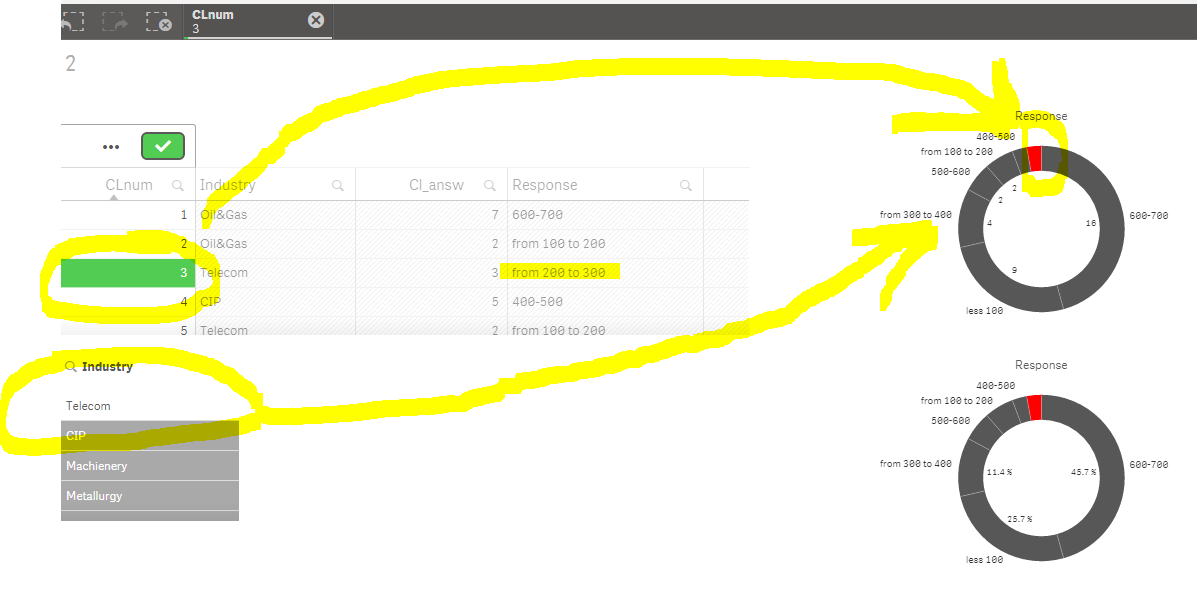
NOW, when you select CLnum -> you have only one Industry available to select (thats correct) - but I don't want to see the list with gray industries:
IS IT POSSIBLE to show "SHOW IN IN INDUSTRY" button - if its pressed (on) - GREEN - the Industry of the Client filter applies, if its not pressed (regular) - no industry filter applied.
- Mark as New
- Bookmark
- Subscribe
- Mute
- Subscribe to RSS Feed
- Permalink
- Report Inappropriate Content
Count({<Response=,Cl_answ=,CLnum=>}Response)
That means, count response no matter the selection of respnse, Cl_answ and CLnum.
When you were using the measure:
count({1}Response) ; the 1 meant count response no matter any selection on any field.
But you can break this appart and choose what to work with ifor you specific measure.
In fact; as I previously said Response= means don't take onto consideration the selections made in the field Response; but in other words, and more accurate one, that means, work with ALL OF THE VALUES of the Response fields.
So Response= means Response=All values.
And that's why if you select a Response, your chart won't be affected since you forced it to work with all the values of the field Response.
Hope that was rather clear
- Mark as New
- Bookmark
- Subscribe
- Mute
- Subscribe to RSS Feed
- Permalink
- Report Inappropriate Content
Is it possible to state not fields you want the chart to be immune to:
Count({<Response=,Cl_answ=,CLnum=>}Response)
but only those fields you want chart to be responsive to
how to state "react only to Industry field" ?