Unlock a world of possibilities! Login now and discover the exclusive benefits awaiting you.
- Qlik Community
- :
- Forums
- :
- Analytics
- :
- New to Qlik Analytics
- :
- Re: How do I sum a range values from a subset of m...
- Subscribe to RSS Feed
- Mark Topic as New
- Mark Topic as Read
- Float this Topic for Current User
- Bookmark
- Subscribe
- Mute
- Printer Friendly Page
- Mark as New
- Bookmark
- Subscribe
- Mute
- Subscribe to RSS Feed
- Permalink
- Report Inappropriate Content
How do I sum a range values from a subset of months from within the range?
Hi
If I have a sales funnel table with two columns
- Month
- Value
And data organised like this:
Month Value
Jan-17 £2400
Feb-17 £500
Mar-17 £12000
Apr-17 £20
May-17 £4000
Jun-17 £1000
What expression do I use to limit the sum value to only Jan-17 to Apr-17?
Thank you
- Mark as New
- Bookmark
- Subscribe
- Mute
- Subscribe to RSS Feed
- Permalink
- Report Inappropriate Content
Try this.
Just add a flag if the month is <= flag and use that in expression
load *,if(Month(Date#(Month,'MMM-YY'))<=4,1,0) as Flag inline [
Month,Value
Jan-17,2400
Feb-17,500
Mar-17,12000
Apr-17,20
May-17,4000
Jun-17,1000];
Below is the expression
=sum({<Flag={1}>}Value)
- Mark as New
- Bookmark
- Subscribe
- Mute
- Subscribe to RSS Feed
- Permalink
- Report Inappropriate Content
Hi Sunny/Omar,
Thanks for your patience, I am a complete novice so this is hard for me.
I have a huge sales funnel of many different values ranged across lots of months in the format MMM-YY.
What I want to do is sum up all of the values for a defined date range, for example Jan-17 to Apr-17.
I think my example data set was very misleading as it only showed 1 value per month date.
In reality there would be hundreds of values in each month date.
It is the sum of the PWP (probability weighted pipeline) that I need to control the date for.
- Mark as New
- Bookmark
- Subscribe
- Mute
- Subscribe to RSS Feed
- Permalink
- Report Inappropriate Content
Hi Sunny
I'd want to see today's Month up to and including a defined cut off Month like Jun-17.
It is the kind of function the date slicer in Excel can do.
Thanks! 
- Mark as New
- Bookmark
- Subscribe
- Mute
- Subscribe to RSS Feed
- Permalink
- Report Inappropriate Content
We completely understand where you are coming from, but here are the few things to check and understand. Is your Date a true date field?
If you fixed your date (or is already in date format), next step is to understand how set analysis work
Once you have all this figured out, you will see how my and Omar's expression (one of the two based on the requirement) is exactly what you are looking for
- Mark as New
- Bookmark
- Subscribe
- Mute
- Subscribe to RSS Feed
- Permalink
- Report Inappropriate Content
Hi Sunny
If I am importing dates from excel that are not proper dates this could explain why I dont get good sorting behavior.
Is there a simple conversion in the import script?
Something to convert my excel MMM-YY into a Qlik recognised date?
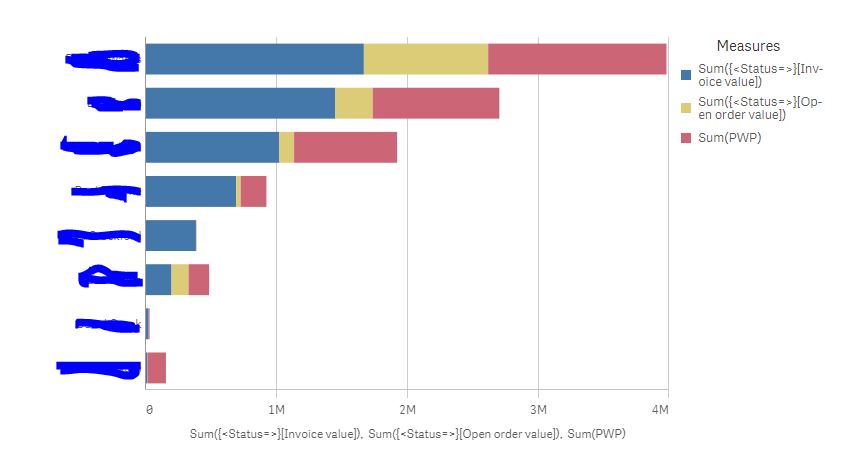
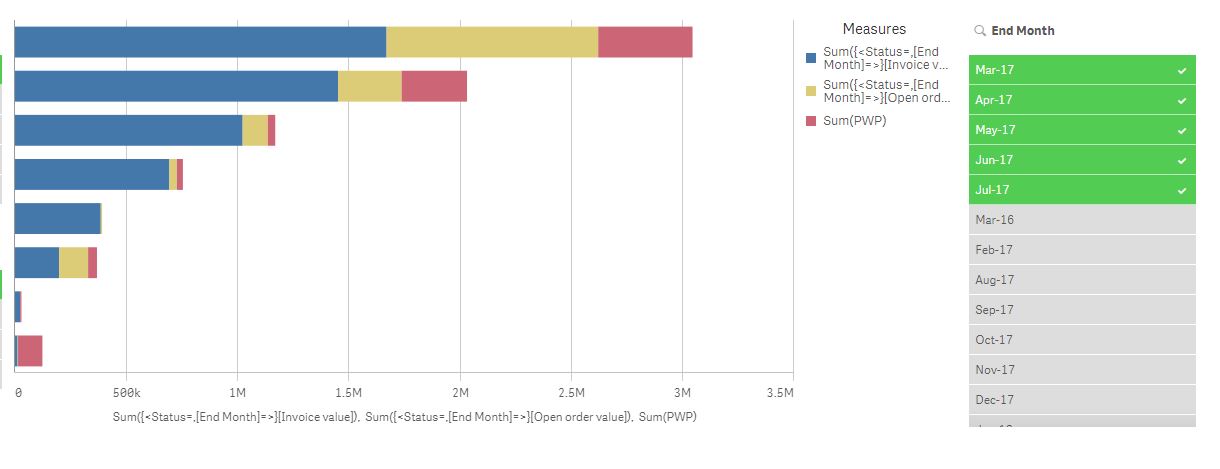
Below you can see my attempt to filter these dates but I think Qlik is not treating them like dates.
- Mark as New
- Bookmark
- Subscribe
- Mute
- Subscribe to RSS Feed
- Permalink
- Report Inappropriate Content
Let's suppose we have this:
load *, Date(date#(Month1,'MMM-YY'),'MMM-YY') as Month;
load * Inline [
Month1, Value1, Value2, Value3
Jan-17, 2400, 300, 500
Feb-17, 500,400,600
Mar-17, 12000,8000,300
Apr-17 , 20,100,500
May-17, 4000,600,50
Jun-17, 1000,300,40
];
So we have 3 measures: sum(Value1), sum(Value2) and sum(Value3)
Now, if we choose a bar chart:
As dimension: Month
As measures:
1)sum(
As dimension: Month
As measures:
1)sum(Value1)
2)sum(Value2)
3)sum(Value3)
Value1)
2)sum(Value2)
3)sum(Value3)
We would have this:
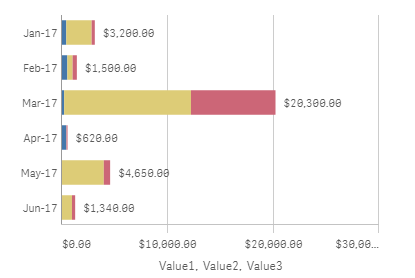
Which is sum(Value1)+Sum(Value2)+Sum(Value3) by month:
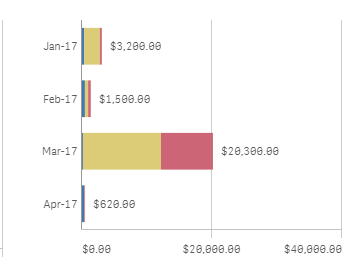
Now we want to limit the months and have the sum only from month >=Jan-17 and <=Apr-17:
We need to alter our expressions:
As dimension: Month
As measures:
1)sum({<Month={"<=Apr-17 >=Jan-17"}>}Value1)
2)sum({<Month={"<=Apr-17 >=Jan-17"}>}Value2)
3)sum({<Month={"<=Apr-17 >=Jan-17"}>}Value3)
We will have :
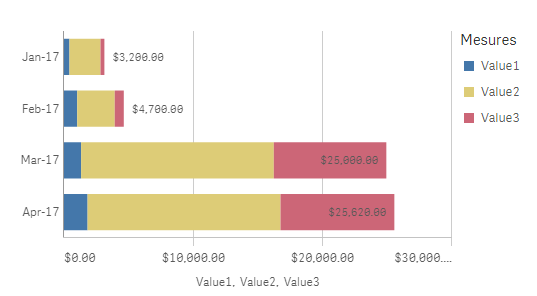
Now: we want to cumulate these measures; we do not need the sum of vale1,2 and 3 by month; but we want them to be cumulative.
So we alter each expression:
1)Rangesum(above( sum({<Month={"<=Apr-17 >=Jan-17"}>}Value1),0,rowno()))
2)Rangesum(above( sum({<Month={"<=Apr-17 >=Jan-17"}>}Value2),0,rowno()))
3)Rangesum(above( sum({<Month={"<=Apr-17 >=Jan-17"}>}Value3),0,rowno()))
Result:
Please see the attached app (second sheet)
And refer to this thread to understand more the set analysis:
- Mark as New
- Bookmark
- Subscribe
- Mute
- Subscribe to RSS Feed
- Permalink
- Report Inappropriate Content
Date(Date#(Month,'MMM-YY'),'DD/MM/YYYY').
Date#() will tell the QlikView the format of the given date, I mean how to read the date and the date() converts that in to the required format.
- Mark as New
- Bookmark
- Subscribe
- Mute
- Subscribe to RSS Feed
- Permalink
- Report Inappropriate Content
The links I shared showed you exactly what you need to do. besides Oman and Shiva have also shown what needs to be done
- Mark as New
- Bookmark
- Subscribe
- Mute
- Subscribe to RSS Feed
- Permalink
- Report Inappropriate Content
Suppose your date field in excel is Jan-17 but it's not really a date that Qlik is recognizing:
Here is how your proceed :
Date(date#(Month,'MMM-YY'),'MMM-YY')
Let's break this to understand it:
1) We know that our field is formatted as follow : 'MMM-YY'; so we want to tell Qlik to believe us, and treat it like a date (a sort of cast):
so what we do is the follow:
Date#(Month,'MMM-YY') : this is like telling Qlik to approach this field like a date and to tell it's formatted like that.
But, in this step, we havn't formatted it yet.
2) Next step is to format it using the Date function (Function with # are for 'casting' without # are for formating)
So what we do: is format our cast "Date#(Month,'MMM-YY') " with Date and entering the new format:
Date(Date#(Month,'MMM-YY') ,'MMM-YY')
Clear enough?
- Mark as New
- Bookmark
- Subscribe
- Mute
- Subscribe to RSS Feed
- Permalink
- Report Inappropriate Content
Hi,
Where would be the best place to put that in the load script?
Do I need to enter it for each LOAD?
SET ThousandSep=',';
SET DecimalSep='.';
SET MoneyThousandSep=',';
SET MoneyDecimalSep='.';
SET MoneyFormat='£#,##0.00;-£#,##0.00';
SET TimeFormat='hh:mm:ss';
SET DateFormat='DD/MM/YYYY';
SET TimestampFormat='DD/MM/YYYY hh:mm:ss[.fff]';
SET FirstWeekDay=0;
SET BrokenWeeks=1;
SET ReferenceDay=0;
SET FirstMonthOfYear=1;
SET CollationLocale='en-GB';
SET CreateSearchIndexOnReload=1;
SET MonthNames='Jan;Feb;Mar;Apr;May;Jun;Jul;Aug;Sep;Oct;Nov;Dec';
SET LongMonthNames='January;February;March;April;May;June;July;August;September;October;November;December';
SET DayNames='Mon;Tue;Wed;Thu;Fri;Sat;Sun';
SET LongDayNames='Monday;Tuesday;Wednesday;Thursday;Friday;Saturday;Sunday';
LOAD
"Expected Comp. Opp." as "End date",
"Last Change",
"Start date",
"Opportunity ID",
"Quote ID",
"Customer Area" as "Sales Area",
"Market Segment" as "Market Sector",
"Org Division" as Division,
Prospect as Customer,
F10 as ERP,
"CRM Product category" as Product,
"Employee Responsible" as "Account Manager",
Phase,
"Phase Since",
Status,
"Status Since",
"Win probability (%)",
£ as "Opp value",
£1,
Region,
"End Month",
"Last Mod Month",
"Start Month",
"PWP"
FROM [lib://General Dashboard/Dashboard Workbook.xlsm]
(ooxml, embedded labels, header is 1 lines, table is [P8C Funnel]);
LOAD
"Fiscal year/period" as "Month",
"Sales document" as "Sales order_OR",
"Customer group 3" as "Sales Area",
"Customer group 1" as "Market Sector",
Division,
"(AG) Sold-To Party" as Customer,
F7 as ERP,
"(ZA) Sales Rep." as "Account Manager",
£ as "Order value",
Region
FROM [lib://General Dashboard/Dashboard Workbook.xlsm]
(ooxml, embedded labels, header is 1 lines, table is [BW Orders received]);
LOAD
"Fiscal year/period" as "Month",
"Sales document" as "Sales order_OO",
"Customer group 3" as "Sales Area",
"Customer group 1" as "Market Sector",
Division,
"(AG) Sold-To Party" as Customer,
F7 as ERP,
"(ZA) Sales Rep." as "Account Manager",
£ as "Open order value",
Region
FROM [lib://General Dashboard/Dashboard Workbook.xlsm]
(ooxml, embedded labels, header is 1 lines, table is [BW Open orders]);
LOAD
"Fiscal year/period" as "Month",
"Sales document" as Invoice,
"Customer group 3" as "Sales Area",
"Customer group 1" as "Market Sector",
Division,
"(AG) Sold-To Party" as Customer,
F8 as ERP,
"(ZA) Sales Rep." as "Account Manager",
£ as "Invoice value",
Region
FROM [lib://General Dashboard/Dashboard Workbook.xlsm]
(ooxml, embedded labels, header is 1 lines, table is [BW Revenue]);
LOAD
"Account Manager",
"Orders Target",
"Revenue Target",
"Sales Region" as Region,
"Sales Area",
"42644",
"42675",
"42705",
"42736",
"42767",
"42795",
"42826",
"42856",
"42887",
"42917",
"42948",
"42979"
FROM [lib://General Dashboard/Dashboard Workbook.xlsm]
(ooxml, embedded labels, table is [Individual targets]);
LOAD
"Goal month",
"Academia goal",
"Industry goal",
"Academia actual",
"Industry actual",
Service
FROM [lib://General Dashboard/Dashboard Workbook.xlsm]
(ooxml, embedded labels, table is [Month targets]);