Unlock a world of possibilities! Login now and discover the exclusive benefits awaiting you.
- Qlik Community
- :
- All Forums
- :
- QlikView App Dev
- :
- Re: Issues with Full Accumulation
- Subscribe to RSS Feed
- Mark Topic as New
- Mark Topic as Read
- Float this Topic for Current User
- Bookmark
- Subscribe
- Mute
- Printer Friendly Page
- Mark as New
- Bookmark
- Subscribe
- Mute
- Subscribe to RSS Feed
- Permalink
- Report Inappropriate Content
Issues with Full Accumulation
Hello
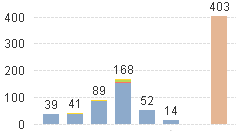
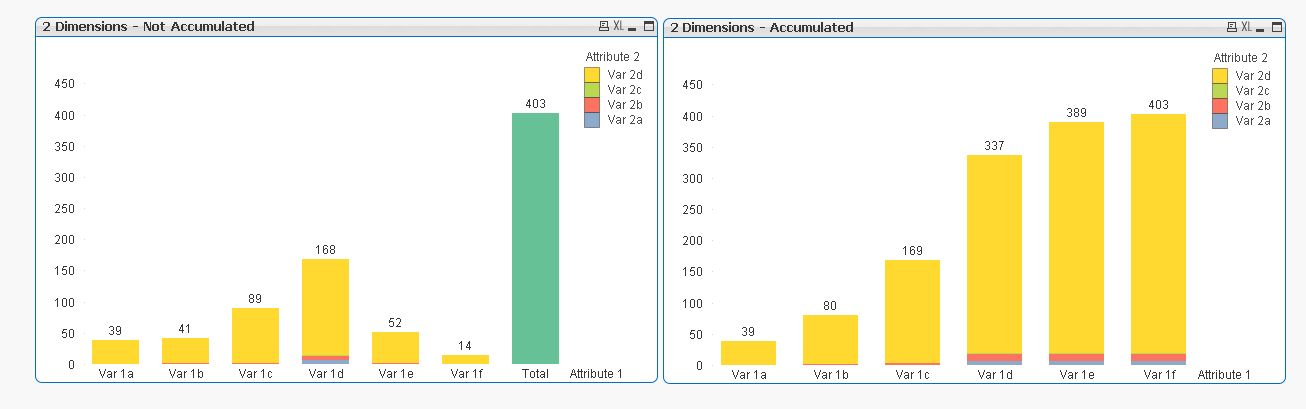
As per the attached images, Full Accumulation is not being properly done. Final total must be 403, but it is 383 (blue only).
If there had been missing values, it would have reflected in both graphs.
What might be the reason for this discrepancy?
Thanks in advance!
- « Previous Replies
-
- 1
- 2
- Next Replies »
- Mark as New
- Bookmark
- Subscribe
- Mute
- Subscribe to RSS Feed
- Permalink
- Report Inappropriate Content
I finally found a solution. But it only works with QV12, because the sortable aggr() function is needed.
I will write a separate article explaining the issues.
TABLE:
LOAD Color,
Date as Datefield
FROM
[Full Accumulation.xlsx]
(ooxml, embedded labels, table is Sheet1);
cart:
LOAD Distinct Color as Color_cart Resident TABLE;
outer join //cart. product, due to no matching...
LOAD Distinct Datefield as Datefield_cart Resident TABLE;
left keep // do NOT use left join, because values will be distinct on both sides...
LOAD Datefield as Datefield_cart,
Datefield,
Color as Color_cart,
Color
Resident TABLE;
DROP Table TABLE;
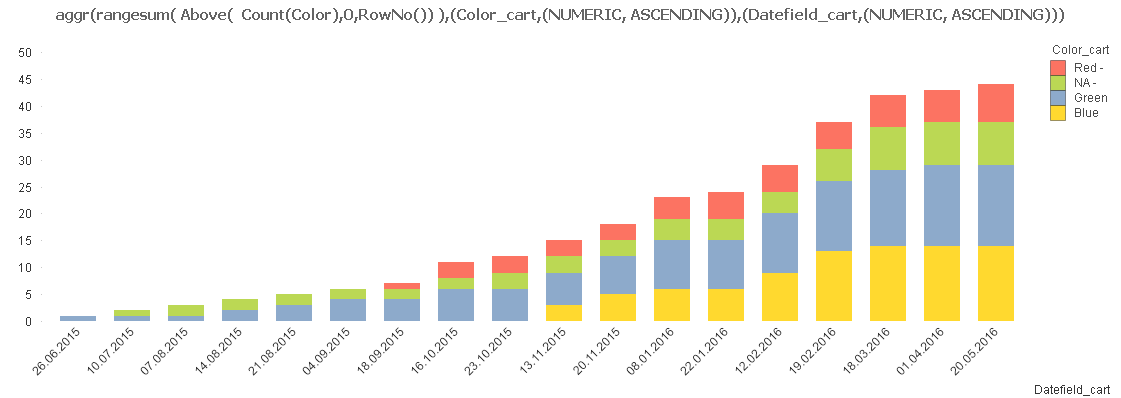
the expression is (syntax check doesn't work for sortable aggr()):
aggr(rangesum( Above( Count(Color),0,RowNo()) ),(Color_cart,(NUMERIC, ASCENDING)),(Datefield_cart,(NUMERIC, ASCENDING)))
- Mark as New
- Bookmark
- Subscribe
- Mute
- Subscribe to RSS Feed
- Permalink
- Report Inappropriate Content
This is working as expected.
Thank you so much
- Mark as New
- Bookmark
- Subscribe
- Mute
- Subscribe to RSS Feed
- Permalink
- Report Inappropriate Content
Script is simple. It looks as expected.
But graph is not appearing in qv file that you uploaded. Can you please recheck.
Thank you
- Mark as New
- Bookmark
- Subscribe
- Mute
- Subscribe to RSS Feed
- Permalink
- Report Inappropriate Content
Do you really use QlikView 12?
I explained the details here:
- Mark as New
- Bookmark
- Subscribe
- Mute
- Subscribe to RSS Feed
- Permalink
- Report Inappropriate Content
Sorry. I am restricted to use QV 11.
But thanks for sharing that stuff
- Mark as New
- Bookmark
- Subscribe
- Mute
- Subscribe to RSS Feed
- Permalink
- Report Inappropriate Content
Hi. Could you help by explaining the principle behind the script
AsOf:
LOAD
DateAsOf,
Date
WHERE
Exists(DateLookup,Date)
AND Exists(DateLookup, DateAsOf)
;
LOAD
Date as DateAsOf,
Date(Date-IterNo()+1) as Date
RESIDENT
Calendar
WHILE
Date-IterNo()+1 >= $(vMinDate)
; .
I would also want my 2 dimension full accumulation to be restricted in a financial year by each financial year. for example my red, green e.t.c accumulate only in my financial year FY1415, then starts a new accumulation in FY1516 etc.
- Mark as New
- Bookmark
- Subscribe
- Mute
- Subscribe to RSS Feed
- Permalink
- Report Inappropriate Content
Hello Gysbert
That script worked fine when I have Date as Dimension, but I am unable to modify it correctly when I have expression (e.g. 'Attribute 2') as Dimension.
Attached is an example. Sum with Full Accumulation should be 403, not 383.
Your help would be greatly appreciated once again.
Thank you so much. Have a great day
Best Regards
Kamil Majeed
- Mark as New
- Bookmark
- Subscribe
- Mute
- Subscribe to RSS Feed
- Permalink
- Report Inappropriate Content
I think the issue is related to missing values.... Try this script
Table:
LOAD Feature,
[Attribute 1],
[Attribute 2],
AutoNumber([Attribute 1]&[Attribute 2]) as Key
FROM
[Testing.xlsx]
(ooxml, embedded labels, table is Sheet1);
Temp:
LOAD Distinct [Attribute 1]
Resident Table;
Left Join (Temp)
LOAD Distinct [Attribute 2]
Resident Table;
Concatenate(Table)
LOAD [Attribute 1],
[Attribute 2]
Resident Temp
Where not Exists(Key, AutoNumber([Attribute 1]&[Attribute 2]));
DROP Table Temp;
- Mark as New
- Bookmark
- Subscribe
- Mute
- Subscribe to RSS Feed
- Permalink
- Report Inappropriate Content
It is working as expected.
Thank you
- Mark as New
- Bookmark
- Subscribe
- Mute
- Subscribe to RSS Feed
- Permalink
- Report Inappropriate Content
I added an extra column 'Identifier' and results are not as expected. i.e. value of 'Total' (chart without accumulation) not matching with final value of chart with accumulation.
- « Previous Replies
-
- 1
- 2
- Next Replies »