Unlock a world of possibilities! Login now and discover the exclusive benefits awaiting you.
- Qlik Community
- :
- Forums
- :
- Analytics
- :
- New to Qlik Analytics
- :
- Re: Color Matrix in Qlik Sense
- Subscribe to RSS Feed
- Mark Topic as New
- Mark Topic as Read
- Float this Topic for Current User
- Bookmark
- Subscribe
- Mute
- Printer Friendly Page
- Mark as New
- Bookmark
- Subscribe
- Mute
- Subscribe to RSS Feed
- Permalink
- Report Inappropriate Content
Color Matrix in Qlik Sense
I want to use color in Straight Table Chart in my application.
for ex: 0 - 5 Green
5 -10 Blue
10 - 25 Yellow
More than 25 Red
- Mark as New
- Bookmark
- Subscribe
- Mute
- Subscribe to RSS Feed
- Permalink
- Report Inappropriate Content
Hi,
Try like this,
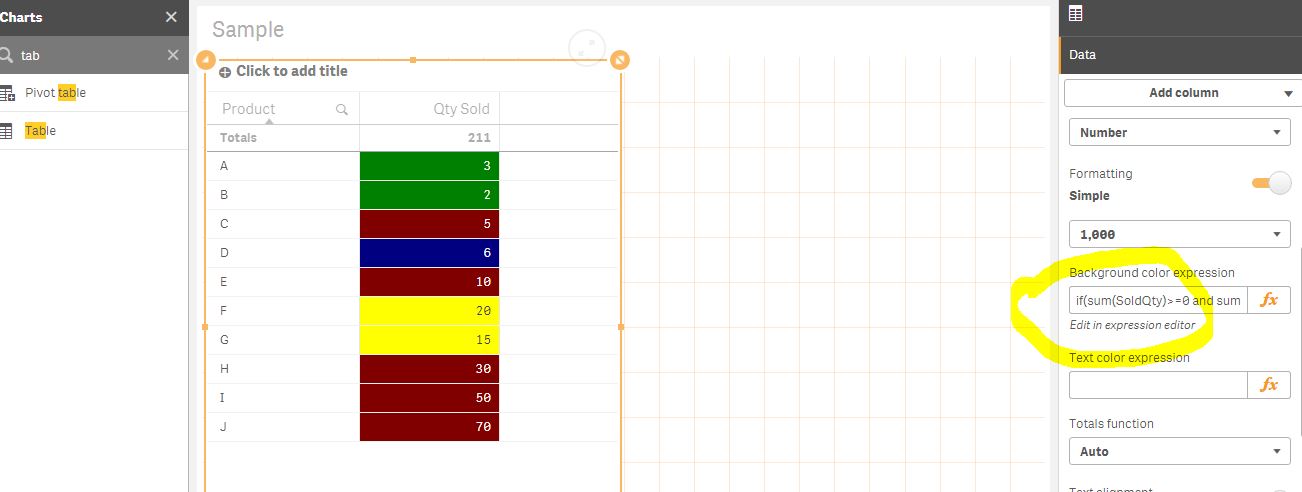
--> in your measure column --> background color --> edit expression and put it like below (remember to change your measure value )
if(sum(SoldQty)>=0 and sum(SoldQty)<5,Green(),
if(sum(SoldQty)>5 and sum(SoldQty)<10,Blue(),
if(sum(SoldQty)>10 and sum(SoldQty)<25,Yellow(),Red() )))
Hope this helps you 
Regards,
Deva
- Mark as New
- Bookmark
- Subscribe
- Mute
- Subscribe to RSS Feed
- Permalink
- Report Inappropriate Content
the above explanation was quite beneficial.
can you please guide me much more enhaned color to understand in the users prospective
- Mark as New
- Bookmark
- Subscribe
- Mute
- Subscribe to RSS Feed
- Permalink
- Report Inappropriate Content
Hi,
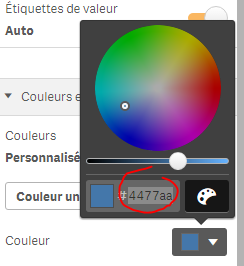
Yeah you can use more custom color like rgb(100, 149, 227).
For more check here.
Coloring by expression ‒ Qlik Sense
Hope this helps you
Regards,
Deva
- Mark as New
- Bookmark
- Subscribe
- Mute
- Subscribe to RSS Feed
- Permalink
- Report Inappropriate Content
Thanks alot devarasu07
- Mark as New
- Bookmark
- Subscribe
- Mute
- Subscribe to RSS Feed
- Permalink
- Report Inappropriate Content
Hi,
If the issue got resolved, help to close this thread by marking correct or helpful
Thanks,
Deva
- Mark as New
- Bookmark
- Subscribe
- Mute
- Subscribe to RSS Feed
- Permalink
- Report Inappropriate Content
Hi,
It may sound strange for users Qlik Sense and require a few additional movements, but the color can be conveniently selected using QlikView. If QlikView is not already installed on your computer, do the following:
1) Download from the site Qlik QlikView Desktop (this is a free version that can be installed on a single computer with Qlik Sense).
2) Create a new database QlikView and on a blank sheet, select, for example, object TextBox (actions on this and the next item 2) and 3) can be seen in the attached file "Color").
3) In properties TextBox on the Caption tab, go to the color definition state (see attached file "Color").
4) The purpose of the elements is as follows
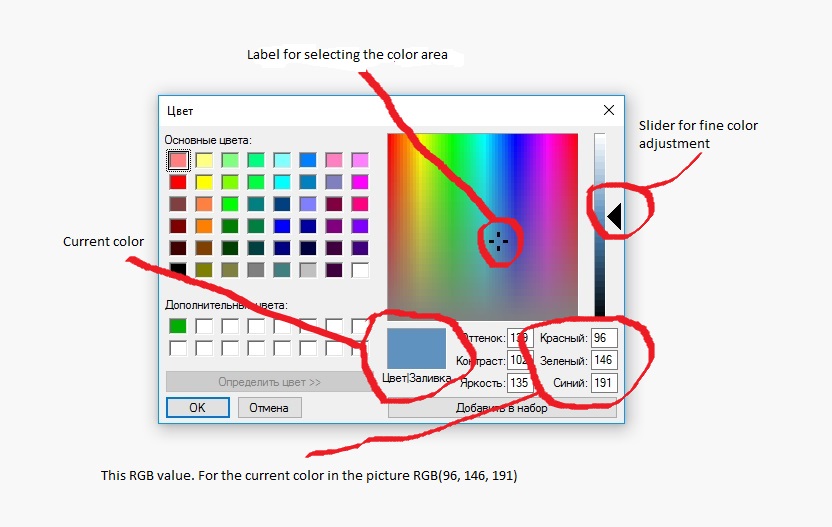
How to choose a color, for example, light red, is shown in the attached file "Color1".
Although requires several additional movements, but I always use this tool to pick colors in the charts.
Regards,
Andrey
- Mark as New
- Bookmark
- Subscribe
- Mute
- Subscribe to RSS Feed
- Permalink
- Report Inappropriate Content
No, you can do similar things with Qlik Sense in any graphic: