Unlock a world of possibilities! Login now and discover the exclusive benefits awaiting you.
- Qlik Community
- :
- All Forums
- :
- QlikView App Dev
- :
- Re: Slow Calculations
- Subscribe to RSS Feed
- Mark Topic as New
- Mark Topic as Read
- Float this Topic for Current User
- Bookmark
- Subscribe
- Mute
- Printer Friendly Page
- Mark as New
- Bookmark
- Subscribe
- Mute
- Subscribe to RSS Feed
- Permalink
- Report Inappropriate Content
Slow Calculations
Good Morning everyone,
I am having an issue with the amount of time it's taking to do a calculation. When I select a singles sales office response is fine, however when I select a company code the CPU pegs.....Here is my count statement.
Thanks
count(distinct(if(FISPD = FISPD_CNT and InActive = '1' and FISYR = FISYR_CNT,[Employee Number])))
- Tags:
- slow_performance
- Mark as New
- Bookmark
- Subscribe
- Mute
- Subscribe to RSS Feed
- Permalink
- Report Inappropriate Content
and joining this fields into PA0000? multiplies the rows or?
- Mark as New
- Bookmark
- Subscribe
- Mute
- Subscribe to RSS Feed
- Permalink
- Report Inappropriate Content
By adding FISPD and FISYR to PA0000, can't you just do:
=count(distinct {<InActive = {1}>} [Employee Number])
And not go to the EMP_CNTS table at all?
- Mark as New
- Bookmark
- Subscribe
- Mute
- Subscribe to RSS Feed
- Permalink
- Report Inappropriate Content
=count(distinct {<InActive = {1}>} [Employee Number]) This tells me how many employees have been terminated and why. The EMP_CNT table tells me how many active employees I had each year,quarter, month and week. I need both to determine turnover %.
Thanks
- Mark as New
- Bookmark
- Subscribe
- Mute
- Subscribe to RSS Feed
- Permalink
- Report Inappropriate Content
I gotcha.
I think the only way you're going to get rid of your Key1=Key2 is to create a link table in the middle of the 3 tables PA0000, EMP_CNTS, and Cost Center...
Doing something like this maybe:
- Mark as New
- Bookmark
- Subscribe
- Mute
- Subscribe to RSS Feed
- Permalink
- Report Inappropriate Content
So, to summarize my understanding:
- you have multiple fact tables (some of them aggregated) and to avoid synthetic keys, you renamed identical fields like Profit Center, FY, FQ, FP in one (some) of the tables
- now, you are trying to restore the same associations in a chart expression using multiple IF Conditions and tying these multiple renamed fields, and it is obviously very slow.
If I may suggest... You are always better off to leverage Qlik associative logic and resolve these issues in your data model, rather than in a chart expression. Working with Qlik data associations is a lot faster than trying to tie the same fields using IF conditions.
So, one option is to build a Link Table that would connect the multiple fact tables with their identical Key fields (Profit Center, TY, FQ, FP, ...). Refer to Barry Harmsen's "Data Modeling" session from the Masters Summit for a practical example of how to do it.
For truly large data sets, however, we know that Link Tables don't perform very well (remember my Performance Tuning session at the Masters Summit?). Therefore, we typically recommend concatenating multiple facts into a single Fact Table. Sometimes it requires restoring some missing associations, but it's worth the trouble because of the better performance. Barry's session covers these topics, too.
Once you have one of the two "valid" data models for multiple fact tables (either a Link Table, or a Concatenated Fact), then you won't need to tie multiple renamed fields together, and your remaining conditions will be simple enough for a simple Set Analysis (covered in my session at the Masters Summit).
I think you have all the tools in your hands, now it's just about applying them to your pretty complex business scenario.
cheers,
Oleg Troyansky
- Mark as New
- Bookmark
- Subscribe
- Mute
- Subscribe to RSS Feed
- Permalink
- Report Inappropriate Content
I was able to get everything onto one table using the function Concat. Here is my script and at the bottom I shared a snapshot of the report.
Temp:
LOAD FISPD,
FISYR,
[Billing Date] as [Start Date],
WEDAT,
WKNO
// autonumber(FISYR&'|'&FISPD) as KEY2
FROM
where FISYR >= '$(vPYear)' and FISYR < '$(vYear)';
Left Join Temp:
LOAD * INLINE [FISPD, QTR, MTH
001, 1, Jan,
002, 1, Feb,
003, 1, Mar,
004, 2, Apr,
005, 2, May,
006, 2, Jun,
007, 3, Jul,
008, 3, Aug,
009, 3, Sep,
010, 4, Oct,
011, 4, Nov,
012, 4, Dec
];
Left Join (Temp)
LOAD
[End Date],
[Start Date],
Year((Date(Floor([Start Date])))) as StartYear,
num(Date(Floor([Start Date]))) as NumStartDate,
[Employee Number],
[Employee Number] as PA0000_EmpID,
[Employee Number] as PA0041_EmpID,
[Reason f.Action_MASSG],
[Action Type_MASSN] as [Action Type],
Employment_STAT2,
[Week Ending],
[Reason f.Action_MASSG] & [Action Type_MASSN] as [Term Event]
FROM
Where Employment_STAT2 = '0' or
Employment_STAT2 = '1' or
Employment_STAT2 = '2'
;
Right Join (Temp)
LOAD [Employee Number],
Max([Start Date]) as [Start Date]
Resident Temp
Where Year([Start Date]) >= '$(vPrevYear)'
Group By [Employee Number]
;
NoConcatenate
PA0000:
LOAD *,
if(Match([Action Type],'24','25','26','27','77','78','79','84'),1,0) as InActive
Resident Temp
Where Year([Start Date]) >= '$(vPrevYear)'
;
DROP Table Temp;
Left join (PA0000)
LOAD
[Employee Number],
[Employee Number] as EmpNo,
[Profit Center],
Job_STELL
FROM
(
where [End Date] = '9999-12-31'
;
Emp_Summ:
LOAD [Profit Center],
FISYR,
QTR,
FISPD,
WEDAT,
WKNO,
TIMEIND,
Avg_Emp_Cnt
FROM
(
CONCATENATE (PA0000)
LOAD *
RESIDENT Emp_Summ;
DROP TABLE Emp_Summ;
EXIT Script;
Now if you notice my report I have one line which is null values and I need to display that value on every line.....for example for 2017 the number 18 should be on every line so I can calc the % by action.
Thanks

- Mark as New
- Bookmark
- Subscribe
- Mute
- Subscribe to RSS Feed
- Permalink
- Report Inappropriate Content
You can use the TOTAL qualifier in your expression to achieve that (use a field list to only apply total on parts of your dimensions, not listed in the field list):
For example
=Sum(TOTAL<FISYR> Avg_Emp_Cnt)
- Mark as New
- Bookmark
- Subscribe
- Mute
- Subscribe to RSS Feed
- Permalink
- Report Inappropriate Content
Thanks Stefan,
Worked perfectly. Now the next question. I have Quarters, months and weeks. How can that be handled? Here is what I see with quarters.....
- Mark as New
- Bookmark
- Subscribe
- Mute
- Subscribe to RSS Feed
- Permalink
- Report Inappropriate Content
Maybe just adapt the TOTAL qualifier field list to the fields used in your dimension (the dimension fields you still like to group your data by).
=Sum(TOTAL<QTR> Avg_Emp_Cnt)
If you need to restric the data to specific years and you do this in your expression, apply the same using e.g. set analysis.
BTW. It's easier to help if you describe your charts in terms of dimensions and expressions used (in combination with a screenshot).
- Mark as New
- Bookmark
- Subscribe
- Mute
- Subscribe to RSS Feed
- Permalink
- Report Inappropriate Content
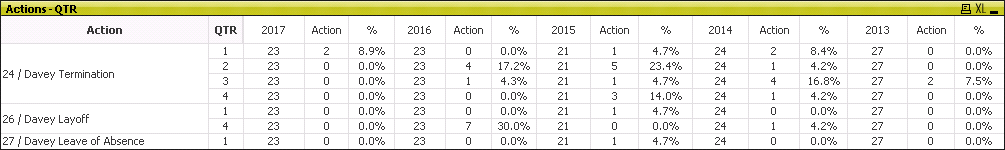
I have 2 tables which I have concatenated. One is a detail table and the other is summary count of the average number of employees by Office, Year, Quarter, Month and Week. I need to create charts showing reason for turnover (action) based on the above time dims. The example you furnished me for years works great. I used this:
Sum(TOTAL{<FISYR = {$(=$(vFisYr) - 0)},TIMEIND = {Y}>} Avg_Emp_Cnt)
The attached screen shot is based on Quarters, but shows the total year. When I change the TIMEIND to "Q" is sums all the Quarters together (50). I should have 22 employees in Q1, and 28 employees in Q2.
Thanks for all your help.