Unlock a world of possibilities! Login now and discover the exclusive benefits awaiting you.
- Qlik Community
- :
- All Forums
- :
- Qlik NPrinting
- :
- Re: Pixel perfect table
- Subscribe to RSS Feed
- Mark Topic as New
- Mark Topic as Read
- Float this Topic for Current User
- Bookmark
- Subscribe
- Mute
- Printer Friendly Page
- Mark as New
- Bookmark
- Subscribe
- Mute
- Subscribe to RSS Feed
- Permalink
- Report Inappropriate Content
Pixel perfect table
Hi all,
i am having trouble trying to get a table in a pixel perfect report within a level (QlikView to NP17.3.1)
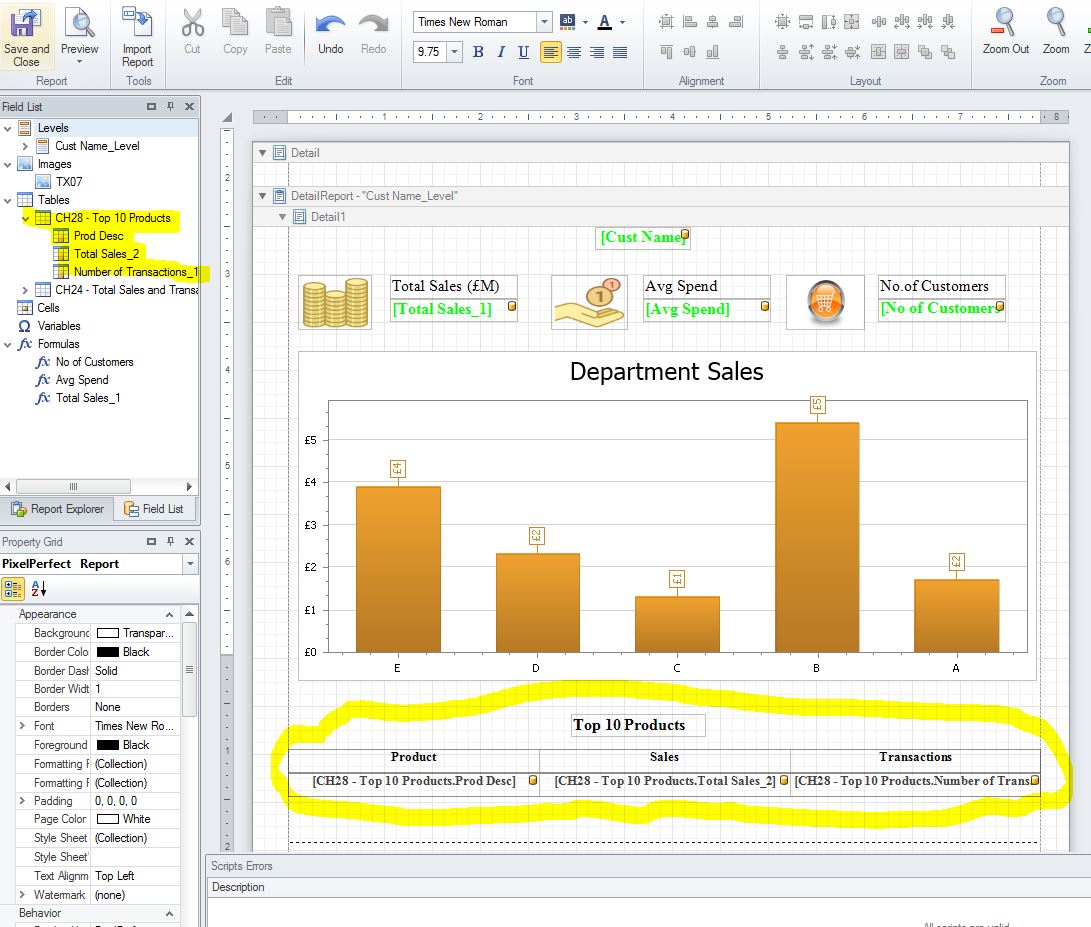
basically i have a level which splits the data by 'Customer', within this level i have created a bar chart showing sales by dept. up to this point works as expected, i get a 10 page report, each page for a different customer displaying the department sales relating to that customer.
I am now trying to add in a table which shows the top 10 selling products. this also needs to go on each page which is split by customer so it only shows the data for the particular customer that is on that page.
I cant get this to work at all, i'm sure its something i am doing wrong but if anyone could offer any help that would be great.
here is a screenshots of my template..
and a screenshot of the output..
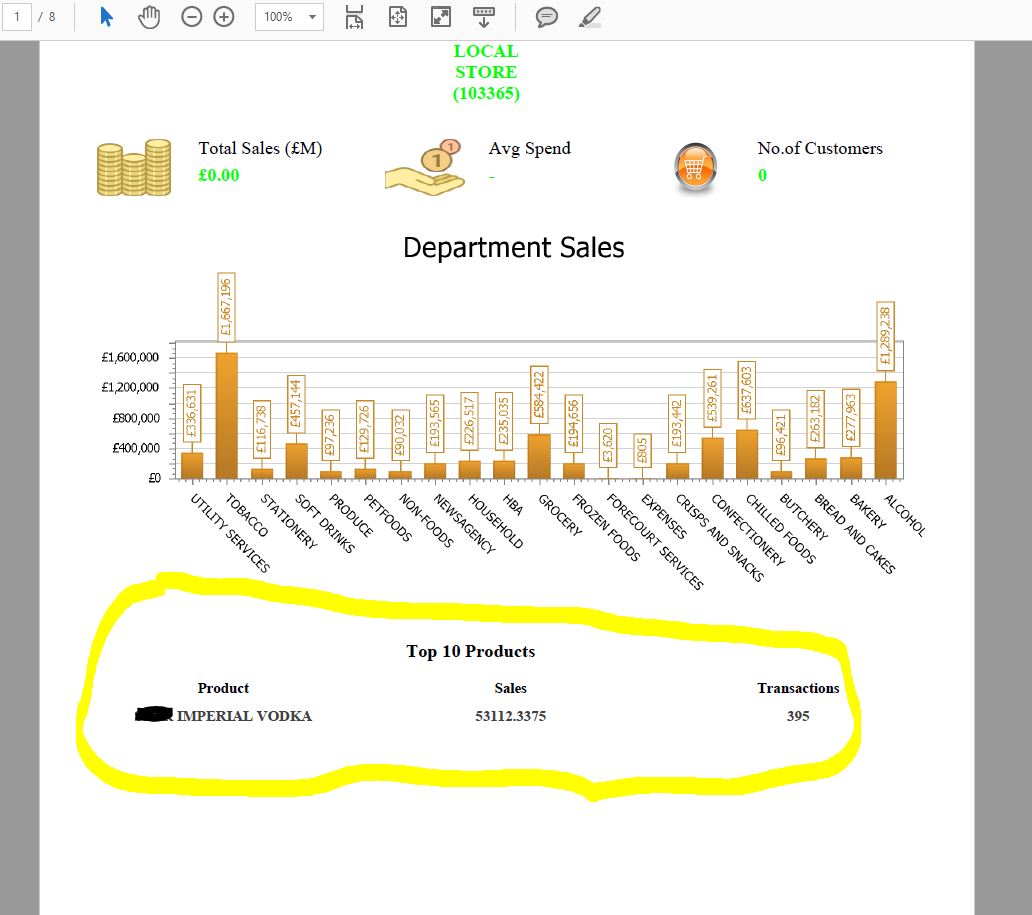
as you can see only 1 row is appearing, it is being split correctly by the customer level though but there are 10 rows in the table in QV.
how do i get all rows into the report?
any help would be appreciated.
- Mark as New
- Bookmark
- Subscribe
- Mute
- Subscribe to RSS Feed
- Permalink
- Report Inappropriate Content
bump
- Mark as New
- Bookmark
- Subscribe
- Mute
- Subscribe to RSS Feed
- Permalink
- Report Inappropriate Content
Hi,
The report has exceeded the size limit,can you try to shrink the size of the objects or may be move the Chart to next page
- Mark as New
- Bookmark
- Subscribe
- Mute
- Subscribe to RSS Feed
- Permalink
- Report Inappropriate Content
Hi Prachi,
why do you say that its exceeded the size limit?
on the output there is a quarter of the page left (blank) and all i want is the additional 9 rows.
I have tried moving the bottom page break and margin down but it makes no difference, i only get 1 row of data.
- Mark as New
- Bookmark
- Subscribe
- Mute
- Subscribe to RSS Feed
- Permalink
- Report Inappropriate Content
What I understood is it goes to the bottom of the page and shows last row.
Can you try to create an excel output and see if the same happens?
Also, for pixel perfect can you try to reduce the 100% (on the second screen above) to around 70% and see what is the change ?
- Mark as New
- Bookmark
- Subscribe
- Mute
- Subscribe to RSS Feed
- Permalink
- Report Inappropriate Content
Hi Chris, I think that the product table will need another level by product so it iterates and shows a line by each product.
- Mark as New
- Bookmark
- Subscribe
- Mute
- Subscribe to RSS Feed
- Permalink
- Report Inappropriate Content
Hi Ruben,
how do i go about adding another level within a level?
- Mark as New
- Bookmark
- Subscribe
- Mute
- Subscribe to RSS Feed
- Permalink
- Report Inappropriate Content
As I remember it was only rigth-click on the first level (customer level in your case) and select the option to add another level.
If my idea is correct the chart and the header of the product table will go above the new sub-level and the product lines inside the new level level
I have searched a similar example in the NPrinting help:
In video:
- Mark as New
- Bookmark
- Subscribe
- Mute
- Subscribe to RSS Feed
- Permalink
- Report Inappropriate Content
thanks Ruben,
i can't get it to work so i have reverted to excel instead of PixelPerfect.