Unlock a world of possibilities! Login now and discover the exclusive benefits awaiting you.
- Qlik Community
- :
- Forums
- :
- Analytics
- :
- New to Qlik Analytics
- :
- Re: Select Values by condition in Qlik Sense
- Subscribe to RSS Feed
- Mark Topic as New
- Mark Topic as Read
- Float this Topic for Current User
- Bookmark
- Subscribe
- Mute
- Printer Friendly Page
- Mark as New
- Bookmark
- Subscribe
- Mute
- Subscribe to RSS Feed
- Permalink
- Report Inappropriate Content
Select Values by condition in Qlik Sense
Hi there,
I am having some trouble with data selections in Qlik sense desktop.
First of all, is there a comprehensive overview for all functions? The Qlik Help seems a little obscure to me.
One of my problem is, I want to show values in a diagram where a corresponding value is unique. e.g.
Col1 Col2
a x a x
a x b y
b y c y
b y ->
b y
c y
c y
So I want to filter for distinct values in Col1 (which I can do by DISTINCT) but I want to show the frequency of the values in Col2.
which would be x=1, y=2
Is there maybe something like Rs [] selector in Qlik Sense?
I am glad for any input.
- Mark as New
- Bookmark
- Subscribe
- Mute
- Subscribe to RSS Feed
- Permalink
- Report Inappropriate Content
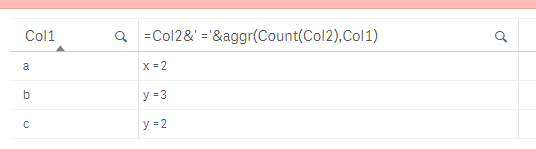
Like this?
=Col2&' ='&aggr(Count(Col2),Col1)
- Mark as New
- Bookmark
- Subscribe
- Mute
- Subscribe to RSS Feed
- Permalink
- Report Inappropriate Content
Here's a script and function guide Marco
https://help.qlik.com/en-US/sense/1.1/pdf/Script%20Syntax%20and%20Chart%20Functions%20Guide.pdf
Ben
- Mark as New
- Bookmark
- Subscribe
- Mute
- Subscribe to RSS Feed
- Permalink
- Report Inappropriate Content
Hi Marco,
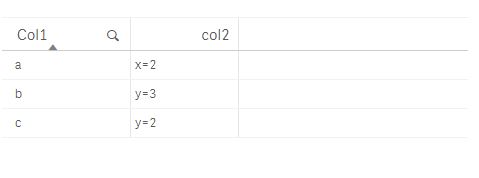
Try this Expression Also,
-->>=Col2 &'='&count( Col2)
Output:
Thank's & Regards,
Sumit Jadhav.
- Mark as New
- Bookmark
- Subscribe
- Mute
- Subscribe to RSS Feed
- Permalink
- Report Inappropriate Content
Thanks Ben,
this is really helpful.
- Mark as New
- Bookmark
- Subscribe
- Mute
- Subscribe to RSS Feed
- Permalink
- Report Inappropriate Content
Hey Omar,
thanks for your suggestion but that is not quite what I meant. Maybe I did not put my question clear enough.
I want to aggregate over all values. In my example you can treat the rows with the same values as duplicates and I want to have the count of x and y after removing the duplicates based on col1.
So the result would be x=1, because only a has the value x and y=2 because (ignoring duplicates) b and c have the value y.
- Mark as New
- Bookmark
- Subscribe
- Mute
- Subscribe to RSS Feed
- Permalink
- Report Inappropriate Content
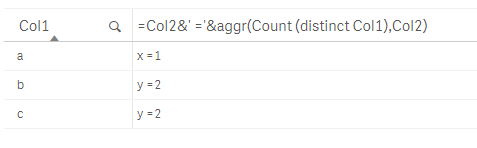
I see, change it as follow then:
=Col2&' ='&aggr(Count (distinct Col1),Col2)