Unlock a world of possibilities! Login now and discover the exclusive benefits awaiting you.
- Qlik Community
- :
- Forums
- :
- Analytics
- :
- New to Qlik Analytics
- :
- Re: How to use count() on a joined field?
- Subscribe to RSS Feed
- Mark Topic as New
- Mark Topic as Read
- Float this Topic for Current User
- Bookmark
- Subscribe
- Mute
- Printer Friendly Page
- Mark as New
- Bookmark
- Subscribe
- Mute
- Subscribe to RSS Feed
- Permalink
- Report Inappropriate Content
How to use count() on a joined field?
I made an app in Qlik Sense Desktop that references a few tables in a SQL Server database. The two relevant tables are:
- countLog - the main table, with millions of rows. One of the columns is reasonID, which is an integer.
- reasonComplete - a small lookup table with reasonID as the primary key and a few other columns providing info about each reason.
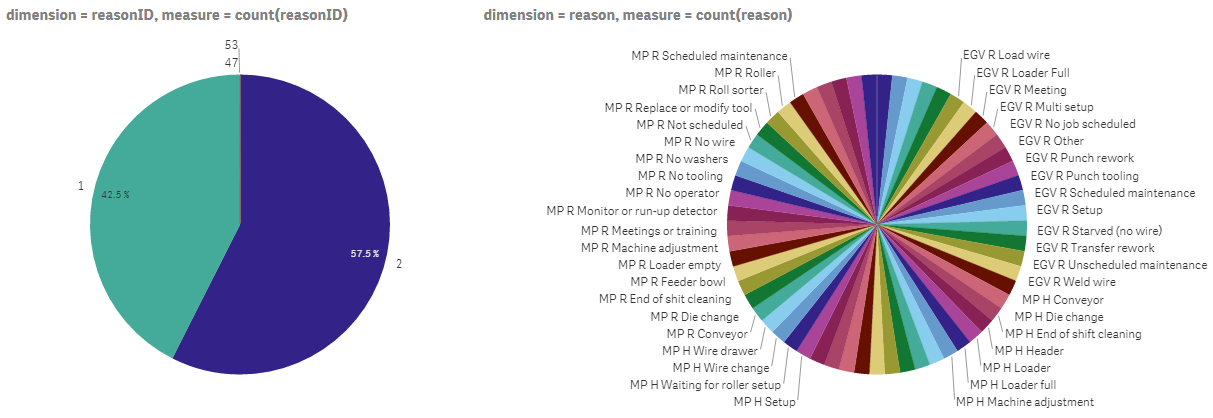
In the data manager, I joined those two tables without a problem. In my worksheet, I added two pie charts, which are shown below. Their title shows the dimension and measure they each use. The chart on the left works as expected. It shows the frequency of each reasonID. The second chart should show the same thing, but with reason text instead of integers. But it doesn't; it just shows every possible reason with an equal slice of the pie.
This is a piece of cake in SQL (see SQL statement below), but I'm struggling with it here. I fear that the "associative data engine" means I have no control over the joining process and thus get unpredictable results, but hopefully, I'm wrong. Can someone point me in the right direction?
The code that does what I want in SQL:
SELECT reason, COUNT(*) AS [count]
FROM countLog AS c
JOIN reasonComplete AS r ON r.reasonID = c.reasonID
GROUP BY reason
ORDER BY COUNT(*) DESC
Accepted Solutions
- Mark as New
- Bookmark
- Subscribe
- Mute
- Subscribe to RSS Feed
- Permalink
- Report Inappropriate Content
I just read Joins and Lookups
It did not alleviate my fears about Qlik's mysteriousness:
The association can be evaluated to a left join or a right join depending on where the user has made a selection. And with no selection, the association is always evaluated to a full outer join.
Anyway, this part seems to explain what is happening here:
If the aggregation is a simple Sum(X), then QlikView will loop over the records of the table where the
field X is found, summing X. But if the expression is Sum (X*Y) and X and Y are found in different tables, then QlikView has to perform the join in memory generating a virtual table over which the summation will be made.
The dimension and measure I'm using in the second pie chart are both available in the reasonComplete table, so QS doesn't bother joining it to countLog. It just looks at the tiny reasonComplete table and heads to the beach to relax. If I could tell QS that what I care about is the reasonID from countLog, it'd probably work, but I don't see any way to do that from the worksheet. I tried this, but it's invalid:
count([countLog.reasonID])
Is there some other way to force it to take countLog into account?
EDIT: yes, there is a way and it's easy!
Just have it count a field that's in countLog but NOT reasonComplete:
The field used is irrelevant as long as it's in the table you want to join to and not in the same table as the dimension.
END OF EDIT
Otherwise, that article leads me to believe that these are my options, none of which is particularly appealing:
- Join the tables using the source DB prior to Qlik data load
- Join the tables using the source DB during Qlik data load
- Join the tables with Qlik during data load
- Join the tables with Qlik during data load, but use the Keep prefix so that the tables are joined on demand instead of ahead of time. This probably wouldn't even help, because just like in the current situation, Qlik probably wouldn't see a reason to trigger the join.
- Use apply_map() or lookup() during Qlik data load to replace reasonID with reason. I don't know how this works under the hood, so I don't know how bad the memory penalty is (reason is way bigger than reasonID). It also only gets you one field from the lookup table instead of all of them.
Anyone have any guidance?
- Mark as New
- Bookmark
- Subscribe
- Mute
- Subscribe to RSS Feed
- Permalink
- Report Inappropriate Content
hi
just use the same expression in the right chart and everything will work right
the engine connects the table as full outer join
but what you did in the right chart
you counted the text field , so the result you got is right , because the table aren't joined together in the script
so each text appears once in the model , because the engine connected the tables
you can use dimension from any table with measure from different table , as long as they are connected
- Mark as New
- Bookmark
- Subscribe
- Mute
- Subscribe to RSS Feed
- Permalink
- Report Inappropriate Content
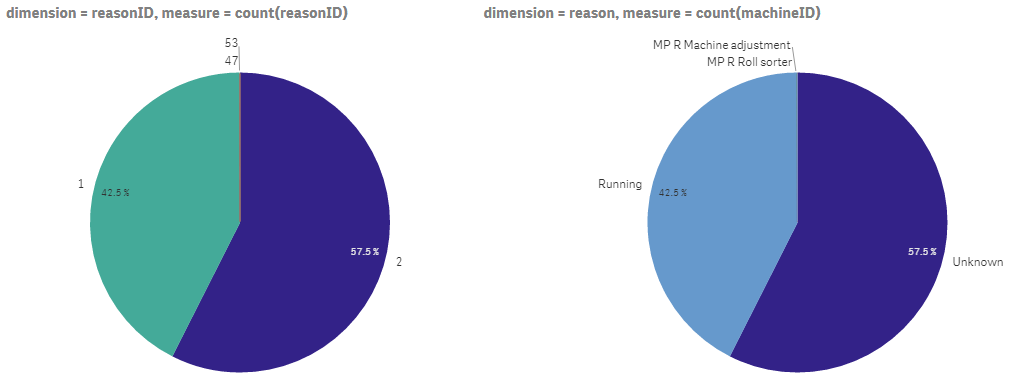
I just tried it and there was no change: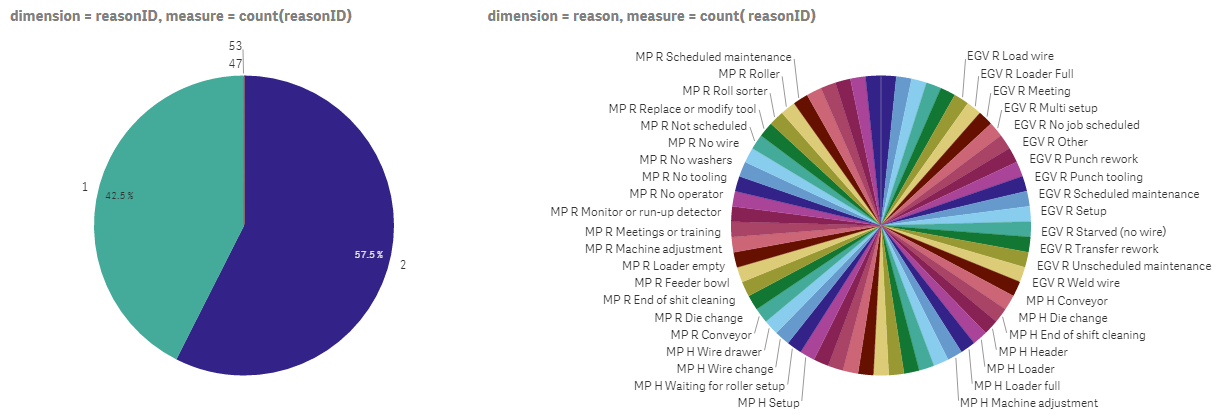
- Mark as New
- Bookmark
- Subscribe
- Mute
- Subscribe to RSS Feed
- Permalink
- Report Inappropriate Content
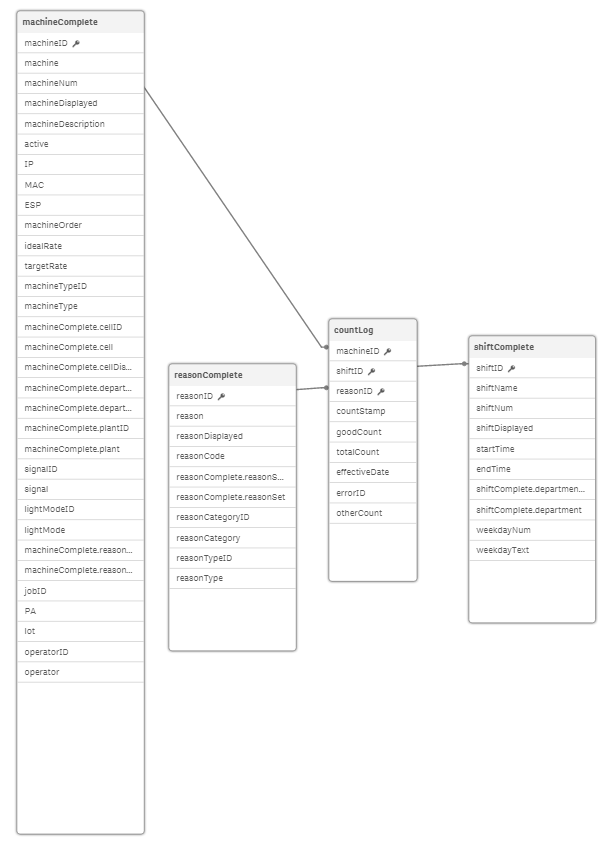
Can you post a picture of your data model with tables expanded to show the field names?
-Rob
- Mark as New
- Bookmark
- Subscribe
- Mute
- Subscribe to RSS Feed
- Permalink
- Report Inappropriate Content
Sure, here it is. I'd upload the whole qvf file, but it's 50 MB. Also, I don't see why it would matter, but in the source database, countLog is an actual table, whereas the other three are views.
- Mark as New
- Bookmark
- Subscribe
- Mute
- Subscribe to RSS Feed
- Permalink
- Report Inappropriate Content
I just read Joins and Lookups
It did not alleviate my fears about Qlik's mysteriousness:
The association can be evaluated to a left join or a right join depending on where the user has made a selection. And with no selection, the association is always evaluated to a full outer join.
Anyway, this part seems to explain what is happening here:
If the aggregation is a simple Sum(X), then QlikView will loop over the records of the table where the
field X is found, summing X. But if the expression is Sum (X*Y) and X and Y are found in different tables, then QlikView has to perform the join in memory generating a virtual table over which the summation will be made.
The dimension and measure I'm using in the second pie chart are both available in the reasonComplete table, so QS doesn't bother joining it to countLog. It just looks at the tiny reasonComplete table and heads to the beach to relax. If I could tell QS that what I care about is the reasonID from countLog, it'd probably work, but I don't see any way to do that from the worksheet. I tried this, but it's invalid:
count([countLog.reasonID])
Is there some other way to force it to take countLog into account?
EDIT: yes, there is a way and it's easy!
Just have it count a field that's in countLog but NOT reasonComplete:
The field used is irrelevant as long as it's in the table you want to join to and not in the same table as the dimension.
END OF EDIT
Otherwise, that article leads me to believe that these are my options, none of which is particularly appealing:
- Join the tables using the source DB prior to Qlik data load
- Join the tables using the source DB during Qlik data load
- Join the tables with Qlik during data load
- Join the tables with Qlik during data load, but use the Keep prefix so that the tables are joined on demand instead of ahead of time. This probably wouldn't even help, because just like in the current situation, Qlik probably wouldn't see a reason to trigger the join.
- Use apply_map() or lookup() during Qlik data load to replace reasonID with reason. I don't know how this works under the hood, so I don't know how bad the memory penalty is (reason is way bigger than reasonID). It also only gets you one field from the lookup table instead of all of them.
Anyone have any guidance?