Unlock a world of possibilities! Login now and discover the exclusive benefits awaiting you.
- Qlik Community
- :
- All Forums
- :
- Deployment & Management
- :
- Re: Average of Sum
- Subscribe to RSS Feed
- Mark Topic as New
- Mark Topic as Read
- Float this Topic for Current User
- Bookmark
- Subscribe
- Mute
- Printer Friendly Page
- Mark as New
- Bookmark
- Subscribe
- Mute
- Subscribe to RSS Feed
- Permalink
- Report Inappropriate Content
Average of Sum
Hello,
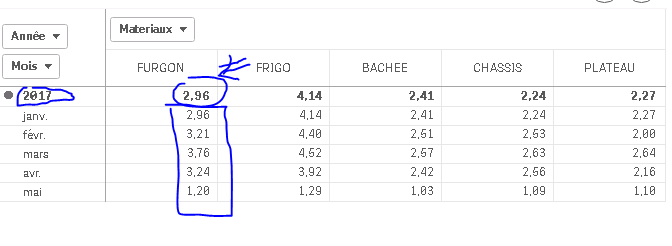
I have this pivot table and i would like to display the average of the sum of all Months :
this is the expression used :
if (Dimensionality()=1, Avg(Aggr( Count({<[Year of date]={"$(=max([Year of date]))"}>}Num_Dossier)
/
Count({<[Year of date]={"$(=max([Year of date]))">}distinct (Plaque)), Plaque,[Month of date] ,[Year of date])),
Count({<[Year of date]={"$(=max([Year of date]))"},>}Num_Dossier)
/
Count({<[Year of date]={"$(=max([Year of date]))"}>}distinct (Plaque)))
He display the value of janv and not the avg
Regards
Accepted Solutions
- Mark as New
- Bookmark
- Subscribe
- Mute
- Subscribe to RSS Feed
- Permalink
- Report Inappropriate Content
I think i find the solution in the aggregation i need to put the year and the materiaux
- Mark as New
- Bookmark
- Subscribe
- Mute
- Subscribe to RSS Feed
- Permalink
- Report Inappropriate Content
You may have encountered a granularity mismatch, won't you need to add Materiaux field to the Aggr() dimensions?
if (Dimensionality()=1, Avg(Aggr( Count({<[Year of date]={"$(=max([Year of date]))"}>}Num_Dossier)
/
Count({<[Year of date]={"$(=max([Year of date]))">}distinct (Plaque)), Materiaux, [Month of date] ,[Year of date])),
- Mark as New
- Bookmark
- Subscribe
- Mute
- Subscribe to RSS Feed
- Permalink
- Report Inappropriate Content
Hello Stefan in the aggregation i added Materiaux and i removed plaque but the same issue,(it display the values of the first month
- Mark as New
- Bookmark
- Subscribe
- Mute
- Subscribe to RSS Feed
- Permalink
- Report Inappropriate Content
You need to use the field that is used to display Materiaux dimension (so not the dimension label if it differs from the field name).
Could you post a small sample?
- Mark as New
- Bookmark
- Subscribe
- Mute
- Subscribe to RSS Feed
- Permalink
- Report Inappropriate Content
Hello Stefan,
example:
for the first materiaux named FURGON ,in 2017 i need to have the average of (2.96 +3.21 +3.76 +3.24 + 1.20)/5=2.87
Regards
- Mark as New
- Bookmark
- Subscribe
- Mute
- Subscribe to RSS Feed
- Permalink
- Report Inappropriate Content
Ok, but actually I was asking for a small sample application file or sample set of your data records.
- Mark as New
- Bookmark
- Subscribe
- Mute
- Subscribe to RSS Feed
- Permalink
- Report Inappropriate Content
do you have please gmail id ?
- Mark as New
- Bookmark
- Subscribe
- Mute
- Subscribe to RSS Feed
- Permalink
- Report Inappropriate Content
I think i find the solution in the aggregation i need to put the year and the materiaux