Unlock a world of possibilities! Login now and discover the exclusive benefits awaiting you.
- Qlik Community
- :
- All Forums
- :
- Integration, Extension & APIs
- :
- Re: Sense - Input Box to Filter Table
- Subscribe to RSS Feed
- Mark Topic as New
- Mark Topic as Read
- Float this Topic for Current User
- Bookmark
- Subscribe
- Mute
- Printer Friendly Page
- Mark as New
- Bookmark
- Subscribe
- Mute
- Subscribe to RSS Feed
- Permalink
- Report Inappropriate Content
Sense - Input Box to Filter Table
Hi All,
I can't seem to find the answer I need.
I've installed this input box extension:
I set up a variable and am able to modify the variable by typing into the input box.
I want to filter a table with the input data. I've tried a number of approaches and I just can't figure out where to put the logic. On Qlik Branch I see people have been able to do this. Once I figure it out, I'll put together a nice tutorial for other folks.
Thanks for your help.
Accepted Solutions
- Mark as New
- Bookmark
- Subscribe
- Mute
- Subscribe to RSS Feed
- Permalink
- Report Inappropriate Content
Hi Meg,
What you want to do is
- Define a variable in the load script. For example, Let vMbr = 0;
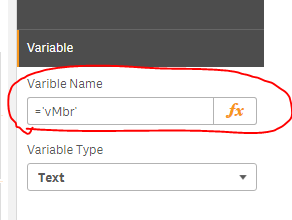
- In the variable name property of the input box, refer to this variable. You need to type the variable name in single quotes.
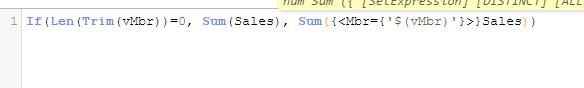
In terms of other charts or tables in your app, you can use set analysis to handle the changes based on the input variables:
Hope this helps
- Mark as New
- Bookmark
- Subscribe
- Mute
- Subscribe to RSS Feed
- Permalink
- Report Inappropriate Content
Input for variables provides you the ability to refer to the variables within expressions.
For instance you are displaying a list of physicians and some data about encounters. Maybe you don't want to see doctors who have had less than revenue than some certain amount.
If you deal with Measures you can simply refer to the value fields you want to compare to a variable directly like the following which says IF this dimensions Revenue is greater than the value I input to a varaible ValueBasedVariable then display the fields amount (I've used two dummy fields as examples. Other wise the measure will be blank.
IF ( Sum(Price*Amount) > $(ValueBasedVariable), Field1)
IF ( Sum(Price*Amount) > $(ValueBasedVariable), Field2)
If you are wondering about why the syntax is $(ValueBasedVariable) that's called Dollar Sign Expansion and you can search that to find more details.
If you do something similar for Measures you can then set the AddOn property to say "Hide Zero Values" and voila the row won't show.
You can also refer to variables inside of Dimension fields but you have to do that slightly differently. You would need to use the AGGR function to roll up values to an in memory hyper cube of sorts based on that dimensions value. So the following rolls up the revenue by year, and would then check that particular row's Year dimension value in the hypercube is greater than the variable then put the Year value. Then you simply uncheck the flag that says "Show Null Values" so the years who's values don't qualify aren't shown.
=If( AGGR(Sum(Price*Amount), Year) > $(ValueBasedVariable) , Year)
- Mark as New
- Bookmark
- Subscribe
- Mute
- Subscribe to RSS Feed
- Permalink
- Report Inappropriate Content
Hi Meg,
What you want to do is
- Define a variable in the load script. For example, Let vMbr = 0;
- In the variable name property of the input box, refer to this variable. You need to type the variable name in single quotes.
In terms of other charts or tables in your app, you can use set analysis to handle the changes based on the input variables:
Hope this helps
- Mark as New
- Bookmark
- Subscribe
- Mute
- Subscribe to RSS Feed
- Permalink
- Report Inappropriate Content
Dalton, thank you for this great information. It will be useful down the road. Sinan is my colleague and knew what I was trying to accomplish and got to the answer. The filter is to narrow down to a single member in our population to query multiple data sources for a dashboard rather than the range, though I think I can use the AGGR method in other areas of the report.
- Mark as New
- Bookmark
- Subscribe
- Mute
- Subscribe to RSS Feed
- Permalink
- Report Inappropriate Content
Thanks Sinan.
And to be more explicit for others, I wound up using:
=If(Len(Trim(vMbr))=0, [fieldMbr], $(vMbr))
I will work on incorporating both solutions into a tutorial for the extension.