Unlock a world of possibilities! Login now and discover the exclusive benefits awaiting you.
- Qlik Community
- :
- Forums
- :
- Analytics
- :
- New to Qlik Analytics
- :
- Re: Pie Chart Aggregation
- Subscribe to RSS Feed
- Mark Topic as New
- Mark Topic as Read
- Float this Topic for Current User
- Bookmark
- Subscribe
- Mute
- Printer Friendly Page
- Mark as New
- Bookmark
- Subscribe
- Mute
- Subscribe to RSS Feed
- Permalink
- Report Inappropriate Content
Pie Chart Aggregation
I'm trying to create a pie chart that looks like this:

But I'm confused as to how I can accomplish this. Essentially it shows which users were active and which weren't. So "Activity" would be the count of all users that have any activity. "No Activity" the sum of all users who have no activity at all. I don't quite understand how I have to define the dimension/measurement in this case.
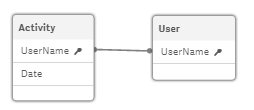
There's two tables, one with the user names and one with the activities. Simplified, the data looks like this:
Attached is also an example app. Thanks in advance.
- Tags:
- pie-chart
Accepted Solutions
- Mark as New
- Bookmark
- Subscribe
- Mute
- Subscribe to RSS Feed
- Permalink
- Report Inappropriate Content
In that case, you have this:
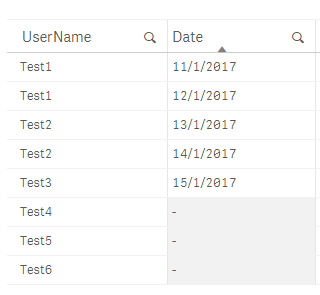
Active is 5? (the 5 dates?) or 3? the 3 users 1,2 and 3?
if we'll count the 5 dates:
Count({<Date={"=Count( UserName)>0"}>}Date)
or just count(Date)
=>which means, count the Date when the Date has a userName (count(user)>0)
if we'll count the 3 users:
Count({<UserName={"=Count( Date)>0"}>}UserName)
=>which means, count UserName when Users have a date
Now, inactive are 3; 3 users without a date (count(date)=0 per user)
Count({<UserName={"=Count( Date)=0"}>}UserName)
=>which means, count userName when the UserName does not have a Date
In the pie chart, the measure would be:
If(ValueList('Active','Inactive') ='Active',Count({<Date={"=Count( UserName)>0"}>}Date),
if(ValueList('Active','Inactive')='Inactive',Count({<UserName={"=Count( Date)=0"}>}UserName))
)
See the attached app
- Mark as New
- Bookmark
- Subscribe
- Mute
- Subscribe to RSS Feed
- Permalink
- Report Inappropriate Content
Use ValueList.
Let me explain,
suppose your have:
Expression1 : sum of Active users
Expression2: sum of Inactive users
To create your pie chart:
as dimension:
ValueList('Active','Inactive')
as measure:
If(ValueList('Active','Inactive') ='Active',Expression1, if(ValueList('Active','Inactive') ='Inactive',Expression2))
- Mark as New
- Bookmark
- Subscribe
- Mute
- Subscribe to RSS Feed
- Permalink
- Report Inappropriate Content
Thanks a lot, that's one step closer to getting to a solution. I'm not quite sure how to count the users that were active/inactive though. I think this has to be done with a set expression, but I may be wrong. The syntax is really weird. This isn't returning correct results, it should've been 50%/50% with my test data, and it ended up being 33.3%/66.7% for some reason:
If(ValueList('Active','Inactive') ='Active',Count(UserName),
   if(ValueList('Active','Inactive')='Inactive',Count( Date={"=Count(Date)>0"}>} UserName ))
)
- Mark as New
- Bookmark
- Subscribe
- Mute
- Subscribe to RSS Feed
- Permalink
- Report Inappropriate Content
The app you've shared does not contains any valuable field (only quarter, year, sales); can you share an app with such an information?
- Mark as New
- Bookmark
- Subscribe
- Mute
- Subscribe to RSS Feed
- Permalink
- Report Inappropriate Content
My bad, I attached the wrong app - I've updated the question now.
- Mark as New
- Bookmark
- Subscribe
- Mute
- Subscribe to RSS Feed
- Permalink
- Report Inappropriate Content
In that case, you have this:
Active is 5? (the 5 dates?) or 3? the 3 users 1,2 and 3?
if we'll count the 5 dates:
Count({<Date={"=Count( UserName)>0"}>}Date)
or just count(Date)
=>which means, count the Date when the Date has a userName (count(user)>0)
if we'll count the 3 users:
Count({<UserName={"=Count( Date)>0"}>}UserName)
=>which means, count UserName when Users have a date
Now, inactive are 3; 3 users without a date (count(date)=0 per user)
Count({<UserName={"=Count( Date)=0"}>}UserName)
=>which means, count userName when the UserName does not have a Date
In the pie chart, the measure would be:
If(ValueList('Active','Inactive') ='Active',Count({<Date={"=Count( UserName)>0"}>}Date),
if(ValueList('Active','Inactive')='Inactive',Count({<UserName={"=Count( Date)=0"}>}UserName))
)
See the attached app
- Mark as New
- Bookmark
- Subscribe
- Mute
- Subscribe to RSS Feed
- Permalink
- Report Inappropriate Content
Thanks a bunch! That is working well.
- Mark as New
- Bookmark
- Subscribe
- Mute
- Subscribe to RSS Feed
- Permalink
- Report Inappropriate Content
Thanks Omar. Its really helped me a lot. Can we split the pie like below. If possible, How can we?
Thanks in advance.
