Unlock a world of possibilities! Login now and discover the exclusive benefits awaiting you.
- Qlik Community
- :
- All Forums
- :
- QlikView App Dev
- :
- Re: Hide rows in a straight table
- Subscribe to RSS Feed
- Mark Topic as New
- Mark Topic as Read
- Float this Topic for Current User
- Bookmark
- Subscribe
- Mute
- Printer Friendly Page
- Mark as New
- Bookmark
- Subscribe
- Mute
- Subscribe to RSS Feed
- Permalink
- Report Inappropriate Content
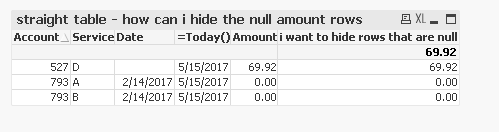
Hide rows in a straight table
I have attached a qvw that shows the raw data and then a second chart that shows 3 rows I want to show and then be able to hide the others. I have a requirement that calls for 2 separate criteria to dictate what rows should be shown and I'm not able to get a calculated dimension to work for hiding the necessary rows. Thanks for you help.
Accepted Solutions
- Mark as New
- Bookmark
- Subscribe
- Mute
- Subscribe to RSS Feed
- Permalink
- Report Inappropriate Content
Hi Kris,
How about this?
I added "0.00005" to Sum(Amount) when the conditions was met. Then in the format tab, I chose to show only two decimals
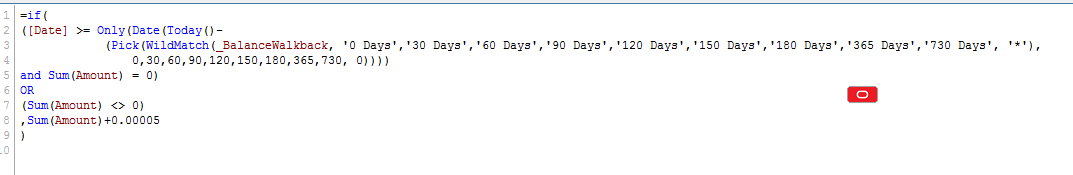
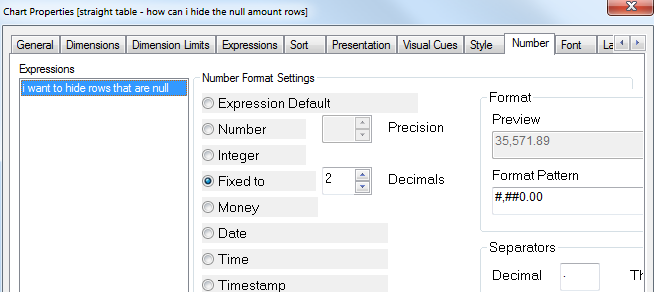
As a result of this, when you choose "suppress zero values", the rows that are met with the conditions would still show.
Let me know if this works
Thanks
- Mark as New
- Bookmark
- Subscribe
- Mute
- Subscribe to RSS Feed
- Permalink
- Report Inappropriate Content
May be supress 0 values in your Presentation tab of the Straight table chart properties. 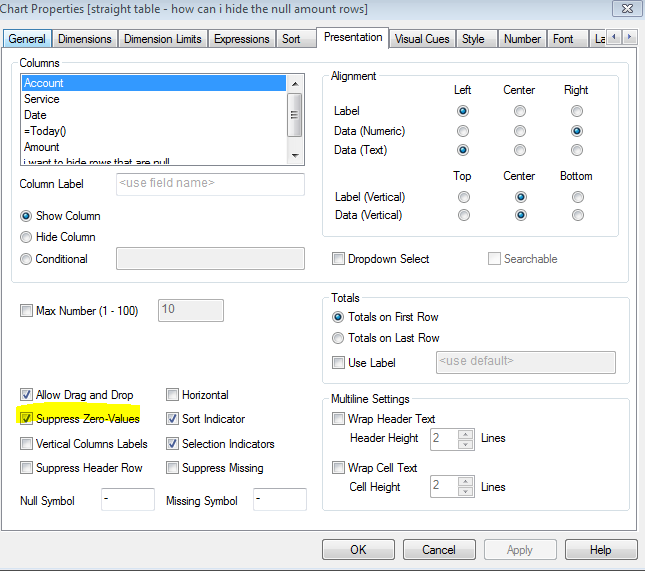
- Mark as New
- Bookmark
- Subscribe
- Mute
- Subscribe to RSS Feed
- Permalink
- Report Inappropriate Content
That won't work because I need to show the zero rows for one half of the requirement. In this example, the rows for Account 793 need to be displayed.
- Mark as New
- Bookmark
- Subscribe
- Mute
- Subscribe to RSS Feed
- Permalink
- Report Inappropriate Content
Hi Kris,
How about this?
I added "0.00005" to Sum(Amount) when the conditions was met. Then in the format tab, I chose to show only two decimals
As a result of this, when you choose "suppress zero values", the rows that are met with the conditions would still show.
Let me know if this works
Thanks
- Mark as New
- Bookmark
- Subscribe
- Mute
- Subscribe to RSS Feed
- Permalink
- Report Inappropriate Content
That is very clever, I never would have thought of that. I will try it out and let you know. Thanks.
- Mark as New
- Bookmark
- Subscribe
- Mute
- Subscribe to RSS Feed
- Permalink
- Report Inappropriate Content
Thats a good idea. Sorry for late reply Kris. Was stuck with something. But probably you should be good with Sinan's idea.
- Mark as New
- Bookmark
- Subscribe
- Mute
- Subscribe to RSS Feed
- Permalink
- Report Inappropriate Content
That seems to work, thanks again.
- Mark as New
- Bookmark
- Subscribe
- Mute
- Subscribe to RSS Feed
- Permalink
- Report Inappropriate Content
You'r welcome.
I am glad it worked.
Thanks