Unlock a world of possibilities! Login now and discover the exclusive benefits awaiting you.
- Qlik Community
- :
- Forums
- :
- Analytics
- :
- New to Qlik Analytics
- :
- Re: Expression help
- Subscribe to RSS Feed
- Mark Topic as New
- Mark Topic as Read
- Float this Topic for Current User
- Bookmark
- Subscribe
- Mute
- Printer Friendly Page
- Mark as New
- Bookmark
- Subscribe
- Mute
- Subscribe to RSS Feed
- Permalink
- Report Inappropriate Content
Expression help
Hi community,
I want to calculate/identify the number of times an employee has performed more than X hours of overtime in a [PayPeriod#].
This be used to help identify individuals who are continually working excessive overtime hours.
X is a variable (vOTLimit) which can be changed through the navigation button extension. Default value is 5 with variable definition simply written as 5. No '' wrapping it or = before hand. If this is wrong let me know also.
Value can be changed to 10,15, 20 or 25.
Overtime hours are calculated through the following set analysis expression which works =
Sum({$<[Time Category A]={'Worked'},[Payment Type Category]={'Overtime'}>}Hours)
This expression will be sitting in a tablebox chart which will simply have the individuals ID number and their name:
| PID | PAN | Employee Name | Number of pay periods overtime has been worked in excess of (vOTLimit) hours |
| XXX | XXX | Bob | 0 |
| AAA | AAA | Jane | 2 |
| BBB | BBB | Paul | 6 |
I tried using a combo of an if statement and an aggr expression but no luck:
Sum(Aggr(If(Sum({$<[Time Category A]={'Worked'},[Payment Type Category]={'Overtime'}>}Hours)>=(vOTLimit),1,0),distinct([PayPeriod#])))
Made the [PayPeriod#] distinct because the [PayPeriod#] is listed against every individual date overtime is worked.
Sample data:
| PID | PAN | Time Category A | Payment Type Category | StartTimeDate | PayPeriod# | sum(Hours) |
| XXX | XXX | Worked | Overtime | 22/04/2017 | PP22/2017 | 1.5 |
| AAA | AAA | Worked | Overtime | 14/05/2016 | PP24/2016 | 6 |
| AAA | AAA | Worked | Overtime | 28/05/2016 | PP25/2016 | 6 |
| BBB | BBB | Worked | Overtime | 2/01/2016 | PP14/2016 | 4 |
| BBB | BBB | Worked | Overtime | 3/01/2016 | PP14/2016 | 3.5 |
| BBB | BBB | Worked | Overtime | 12/02/2016 | PP17/2016 | 2.5 |
| BBB | BBB | Worked | Overtime | 13/02/2016 | PP17/2016 | 4.5 |
| BBB | BBB | Worked | Overtime | 14/02/2016 | PP17/2016 | 4.5 |
| BBB | BBB | Worked | Overtime | 15/02/2016 | PP18/2016 | 3 |
| BBB | BBB | Worked | Overtime | 16/02/2016 | PP18/2016 | 2.5 |
| BBB | BBB | Worked | Overtime | 17/02/2016 | PP18/2016 | 3 |
| BBB | BBB | Worked | Overtime | 18/02/2016 | PP18/2016 | 3.5 |
| BBB | BBB | Worked | Overtime | 18/03/2016 | PP20/2016 | 2.5 |
| BBB | BBB | Worked | Overtime | 19/03/2016 | PP20/2016 | 3.5 |
| BBB | BBB | Worked | Overtime | 20/03/2016 | PP20/2016 | 4 |
| BBB | BBB | Worked | Overtime | 21/03/2016 | PP20/2016 | 2 |
| BBB | BBB | Worked | Overtime | 22/03/2016 | PP20/2016 | 3.5 |
| BBB | BBB | Worked | Overtime | 23/03/2016 | PP20/2016 | 1.5 |
| BBB | BBB | Worked | Overtime | 24/03/2016 | PP20/2016 | 3.5 |
| BBB | BBB | Worked | Overtime | 29/04/2016 | PP23/2016 | 1 |
| BBB | BBB | Worked | Overtime | 30/04/2016 | PP23/2016 | 4.5 |
| BBB | BBB | Worked | Overtime | 1/05/2016 | PP23/2016 | 3 |
| BBB | BBB | Worked | Overtime | 3/05/2016 | PP23/2016 | 3 |
| BBB | BBB | Worked | Overtime | 4/05/2016 | PP23/2016 | 1.5 |
| BBB | BBB | Worked | Overtime | 5/05/2016 | PP23/2016 | 3.5 |
| BBB | BBB | Worked | Overtime | 1/07/2016 | PP1/2017 | 2.5 |
| BBB | BBB | Worked | Overtime | 2/07/2016 | PP1/2017 | 5.5 |
| BBB | BBB | Worked | Overtime | 3/07/2016 | PP1/2017 | 6 |
| BBB | BBB | Worked | Overtime | 4/07/2016 | PP2/2017 | 1.5 |
Accepted Solutions
- Mark as New
- Bookmark
- Subscribe
- Mute
- Subscribe to RSS Feed
- Permalink
- Report Inappropriate Content
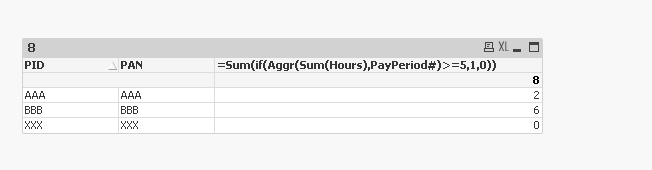
I tried that in Qlikview, is that you want, for now I ignored set analysis
- Mark as New
- Bookmark
- Subscribe
- Mute
- Subscribe to RSS Feed
- Permalink
- Report Inappropriate Content
I tried that in Qlikview, is that you want, for now I ignored set analysis
- Mark as New
- Bookmark
- Subscribe
- Mute
- Subscribe to RSS Feed
- Permalink
- Report Inappropriate Content
That works! Thank you. So the aggr function literally creates a virtual table of data that you can then run other expressions over?
Interestingly though, this works in a KPI chart but it playing up in a straight table in Sense. Not a worry though.
- Mark as New
- Bookmark
- Subscribe
- Mute
- Subscribe to RSS Feed
- Permalink
- Report Inappropriate Content
yes, thats what picked correctly from Aggr , if you observe we don't have PayPeriod# dimension in the table but still we were able to do the aggregation using that also.