Unlock a world of possibilities! Login now and discover the exclusive benefits awaiting you.
- Qlik Community
- :
- All Forums
- :
- QlikView Administration
- :
- Re: insight into actual user usage
- Subscribe to RSS Feed
- Mark Topic as New
- Mark Topic as Read
- Float this Topic for Current User
- Bookmark
- Subscribe
- Mute
- Printer Friendly Page
- Mark as New
- Bookmark
- Subscribe
- Mute
- Subscribe to RSS Feed
- Permalink
- Report Inappropriate Content
insight into actual user usage
Dear all,
For one of our clients I exported an overview of the usage of their dashboard from the governance dashoard.
The question is that it is not really clear what the actual usage/views of the dashboard is, how many unique users have looked into the dashboards?
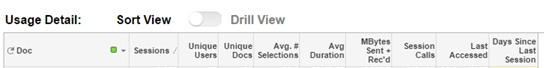
Can someone explain the following columns in plain English what are the metrics behind the following column names?
Sessions:
User selections:
Avg. selections:
Avg. Duration:
MBytes Sent + Rec'd:
Session Calls:
In that way we can conduct research into how often people view our dashboards.
Thanks in advance.
Accepted Solutions
- Mark as New
- Bookmark
- Subscribe
- Mute
- Subscribe to RSS Feed
- Permalink
- Report Inappropriate Content
The columns are more or less self-explaining. If you want the details underlying each column, you can check the expressions (which are often extremely straightforward) and the script code. Everything is log file-based.
In short:
- Sessions = number of client sessions started in the selected period for a particular document
- User selections = number of selections made by a particular user in a particular document during that period
- Avg selections = avg number of selections made in a single session in that period
- Avg duration = avg duration of a single session in that period
- MBytes Sent+Rec'd = millions of bytes sent and received during all sessions for this document in the selected period
- Session Calls = Number of QlikView calls during the all sessions (bidirectional) during that same period
There is an almost one-to-one correspondence between those columns and the base columns in the Server logs. See here for more info: Logs and error codes ‒ QlikView
- Mark as New
- Bookmark
- Subscribe
- Mute
- Subscribe to RSS Feed
- Permalink
- Report Inappropriate Content
Thanks Peter for the quick response. Well stated.
If you want usage - look at sessions & unique users.
If you want more about how active users are in the apps (how engaged perhaps?), add in selections & duration.
If you want an idea of the relative performance impact to servers the sessions are having, use MBytes Sent+Rec'd and Session Calls.