Unlock a world of possibilities! Login now and discover the exclusive benefits awaiting you.
- Qlik Community
- :
- Forums
- :
- Analytics
- :
- New to Qlik Analytics
- :
- Re: Set Analysis - filtering a flied based on sele...
- Subscribe to RSS Feed
- Mark Topic as New
- Mark Topic as Read
- Float this Topic for Current User
- Bookmark
- Subscribe
- Mute
- Printer Friendly Page
- Mark as New
- Bookmark
- Subscribe
- Mute
- Subscribe to RSS Feed
- Permalink
- Report Inappropriate Content
Set Analysis - filtering a flied based on selections on another field
Hi,
I'm having trouble writing a set analysis. I want to display the revenues generated by the people from a Business Unit (no matter if it is generated in another business unit) when said business unit is selected.
In other words :
if my current selection is BU = "A" , then I want sales generated by BU A Salesmen to appear, even if it was generated in BU B
Set analysis should be around : sum( { $ < BU= , BU_Employee= {BU} >}sales)
but I don't seem to be able to make it work.
Sorry, i can't post my data, it's in french and pretty much tangled with a lot of other info.
Thank you for your help,
Aurore
- « Previous Replies
-
- 1
- 2
- Next Replies »
- Mark as New
- Bookmark
- Subscribe
- Mute
- Subscribe to RSS Feed
- Permalink
- Report Inappropriate Content
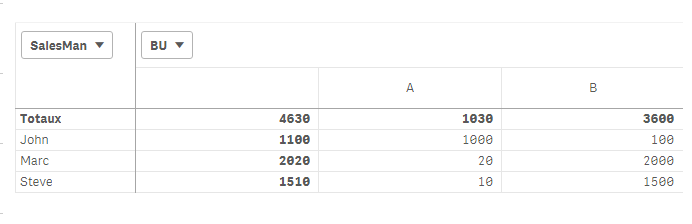
Thanks. I does show proper results per salesman.
However, I cannot plot the same graph with the BU which my businessmen are from (the field is named "BU_Employee")
- Mark as New
- Bookmark
- Subscribe
- Mute
- Subscribe to RSS Feed
- Permalink
- Report Inappropriate Content
Thanks,
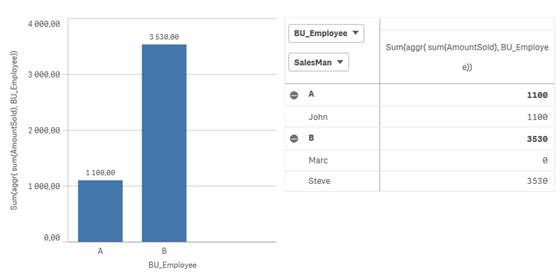
I tried Sum(aggr( sum(AmountSold), BU_Employee)), it shows exactly what I want.
However, i loose all the details per salesman, so it's not ideal.
- Mark as New
- Bookmark
- Subscribe
- Mute
- Subscribe to RSS Feed
- Permalink
- Report Inappropriate Content
I see, what details do you lose and where? What chart does it work in and what one does it not?
- Mark as New
- Bookmark
- Subscribe
- Mute
- Subscribe to RSS Feed
- Permalink
- Report Inappropriate Content
If I chart your solution, it work like a charm :
But I put it in a cross table, not so much
- Mark as New
- Bookmark
- Subscribe
- Mute
- Subscribe to RSS Feed
- Permalink
- Report Inappropriate Content
Thanks, but as I've said I can't select BusinessMan.
I've updated my model for better comprehension.
- Mark as New
- Bookmark
- Subscribe
- Mute
- Subscribe to RSS Feed
- Permalink
- Report Inappropriate Content
is it something like you select a salesman and if he is present in a BU you want to see the Salesman selected + other
salesman who also associated with the BU which the selected salesman is , then my expression would work
- Mark as New
- Bookmark
- Subscribe
- Mute
- Subscribe to RSS Feed
- Permalink
- Report Inappropriate Content
Well if information is a pivot table; you can keep my measure if you do as follow:
- Mark as New
- Bookmark
- Subscribe
- Mute
- Subscribe to RSS Feed
- Permalink
- Report Inappropriate Content
Hi,
Can you try this:
=sum({<BU=, BU_Employee={'$(=GetFieldSelections(BU))'}>}AmountSold)
- Mark as New
- Bookmark
- Subscribe
- Mute
- Subscribe to RSS Feed
- Permalink
- Report Inappropriate Content
It works perfectly !!
Thank you very much
- « Previous Replies
-
- 1
- 2
- Next Replies »