Unlock a world of possibilities! Login now and discover the exclusive benefits awaiting you.
- Qlik Community
- :
- Forums
- :
- Analytics
- :
- New to Qlik Analytics
- :
- Re: Having a problem with pie charts, can someone ...
- Subscribe to RSS Feed
- Mark Topic as New
- Mark Topic as Read
- Float this Topic for Current User
- Bookmark
- Subscribe
- Mute
- Printer Friendly Page
- Mark as New
- Bookmark
- Subscribe
- Mute
- Subscribe to RSS Feed
- Permalink
- Report Inappropriate Content
Having a problem with pie charts, can someone help please
Very new to QlikSense btw
Here's my data
Actvity_id, Status
1,S
2,S
3,S
where status s=success, f=fail, r=running
I want to display a donut pie where for each activity (only 3 on a any day), there is a specific colour for each status
s=green
f=red
r=orange
So we should get a ring of green if all activities are successfully completed. or one third of the donut will look red if theres been a failure.
Can someone help please?
Imran
- Mark as New
- Bookmark
- Subscribe
- Mute
- Subscribe to RSS Feed
- Permalink
- Report Inappropriate Content
Hi! Use color by expression:
If(Status='S', Green(), If(Status='F', Red(), If(Status='R', RGB(255,165,0))))
- Mark as New
- Bookmark
- Subscribe
- Mute
- Subscribe to RSS Feed
- Permalink
- Report Inappropriate Content
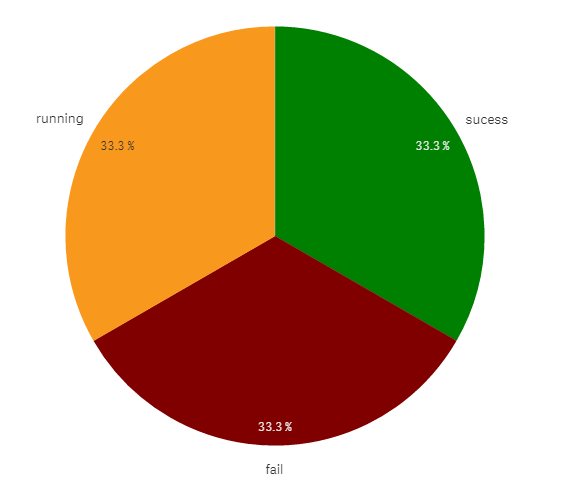
What I would suggest is :
Create a MASTER DIMENSION: ValueList('sucess','fail','running')
Create a MASTER MEASURE:
if(ValueList('sucess','fail','running')='sucess', count({<Status={'S'}>}Activity_id),
if(ValueList('sucess','fail','running')='fail', count({<Status={'F'}>}Activity_id),
if(ValueList('sucess','fail','running')='running', count({<Status={'R'}>}Activity_id) )))
Now, create a pie chart,
as dimension, use your master dimension
as measure , use your master measure
then color by EXPRESSION:
if(ValueList('sucess','fail','running')='sucess', green(),
if(ValueList('sucess','fail','running')='fail', red(),
if(ValueList('sucess','fail','running')='running', '#f8981d' )))
result:
- Mark as New
- Bookmark
- Subscribe
- Mute
- Subscribe to RSS Feed
- Permalink
- Report Inappropriate Content
Fantastic. Thanks to both of you.