Unlock a world of possibilities! Login now and discover the exclusive benefits awaiting you.
- Qlik Community
- :
- Forums
- :
- Analytics
- :
- New to Qlik Analytics
- :
- Multiple Lines for In Line Chart
- Subscribe to RSS Feed
- Mark Topic as New
- Mark Topic as Read
- Float this Topic for Current User
- Bookmark
- Subscribe
- Mute
- Printer Friendly Page
- Mark as New
- Bookmark
- Subscribe
- Mute
- Subscribe to RSS Feed
- Permalink
- Report Inappropriate Content
Multiple Lines for In Line Chart
Hello Everyone,
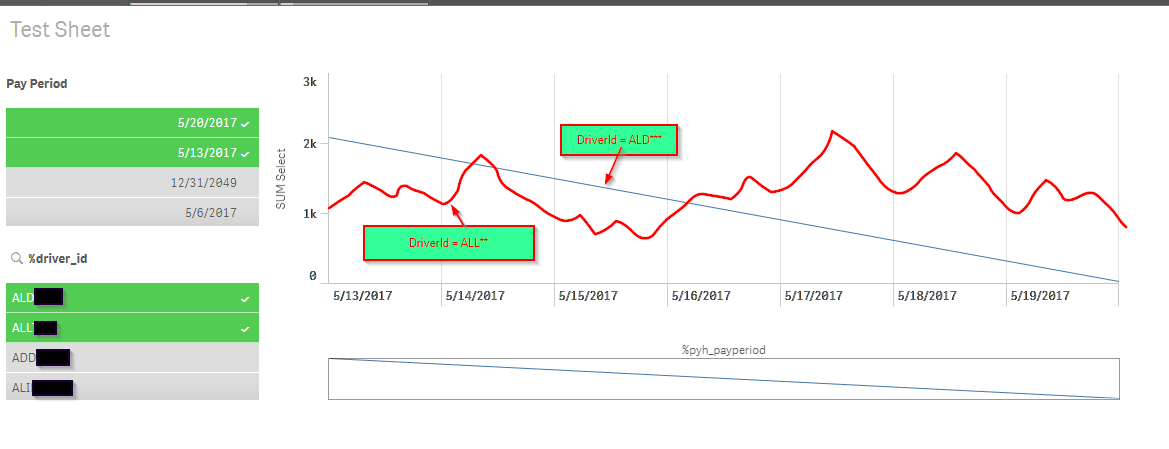
I have a line chart with a dimension of "Pay Period" and a Measure of "SUM Select" (sum of the payments for that Pay Period. In my data model, I have a field called %driverId. So what I would like to do, is for each selected driver to have a line in the LineChart. Here is a screenshot of what I'm trying to accomplish. The awful RedLine in addition to the BlueLine is what I'd like to also appear given that the user has made the selections as shown (forget that the Blue Line represents the sum of the drivers, just assume that it represents the sum for ALD**).
I'm not sure how to accomplish this. Any help is greatly appreciated.
Accepted Solutions
- Mark as New
- Bookmark
- Subscribe
- Mute
- Subscribe to RSS Feed
- Permalink
- Report Inappropriate Content
I'm a dodo bird. This can be accomplished by adding my DriverId as an Alternative Dimension.
- Mark as New
- Bookmark
- Subscribe
- Mute
- Subscribe to RSS Feed
- Permalink
- Report Inappropriate Content
I'm a dodo bird. This can be accomplished by adding my DriverId as an Alternative Dimension.