Unlock a world of possibilities! Login now and discover the exclusive benefits awaiting you.
- Qlik Community
- :
- All Forums
- :
- QlikView App Dev
- :
- Re: How to have chart axis to show only data value
Options
- Subscribe to RSS Feed
- Mark Topic as New
- Mark Topic as Read
- Float this Topic for Current User
- Bookmark
- Subscribe
- Mute
- Printer Friendly Page
Turn on suggestions
Auto-suggest helps you quickly narrow down your search results by suggesting possible matches as you type.
Showing results for
Not applicable
2017-05-21
07:19 PM
- Mark as New
- Bookmark
- Subscribe
- Mute
- Subscribe to RSS Feed
- Permalink
- Report Inappropriate Content
How to have chart axis to show only data value
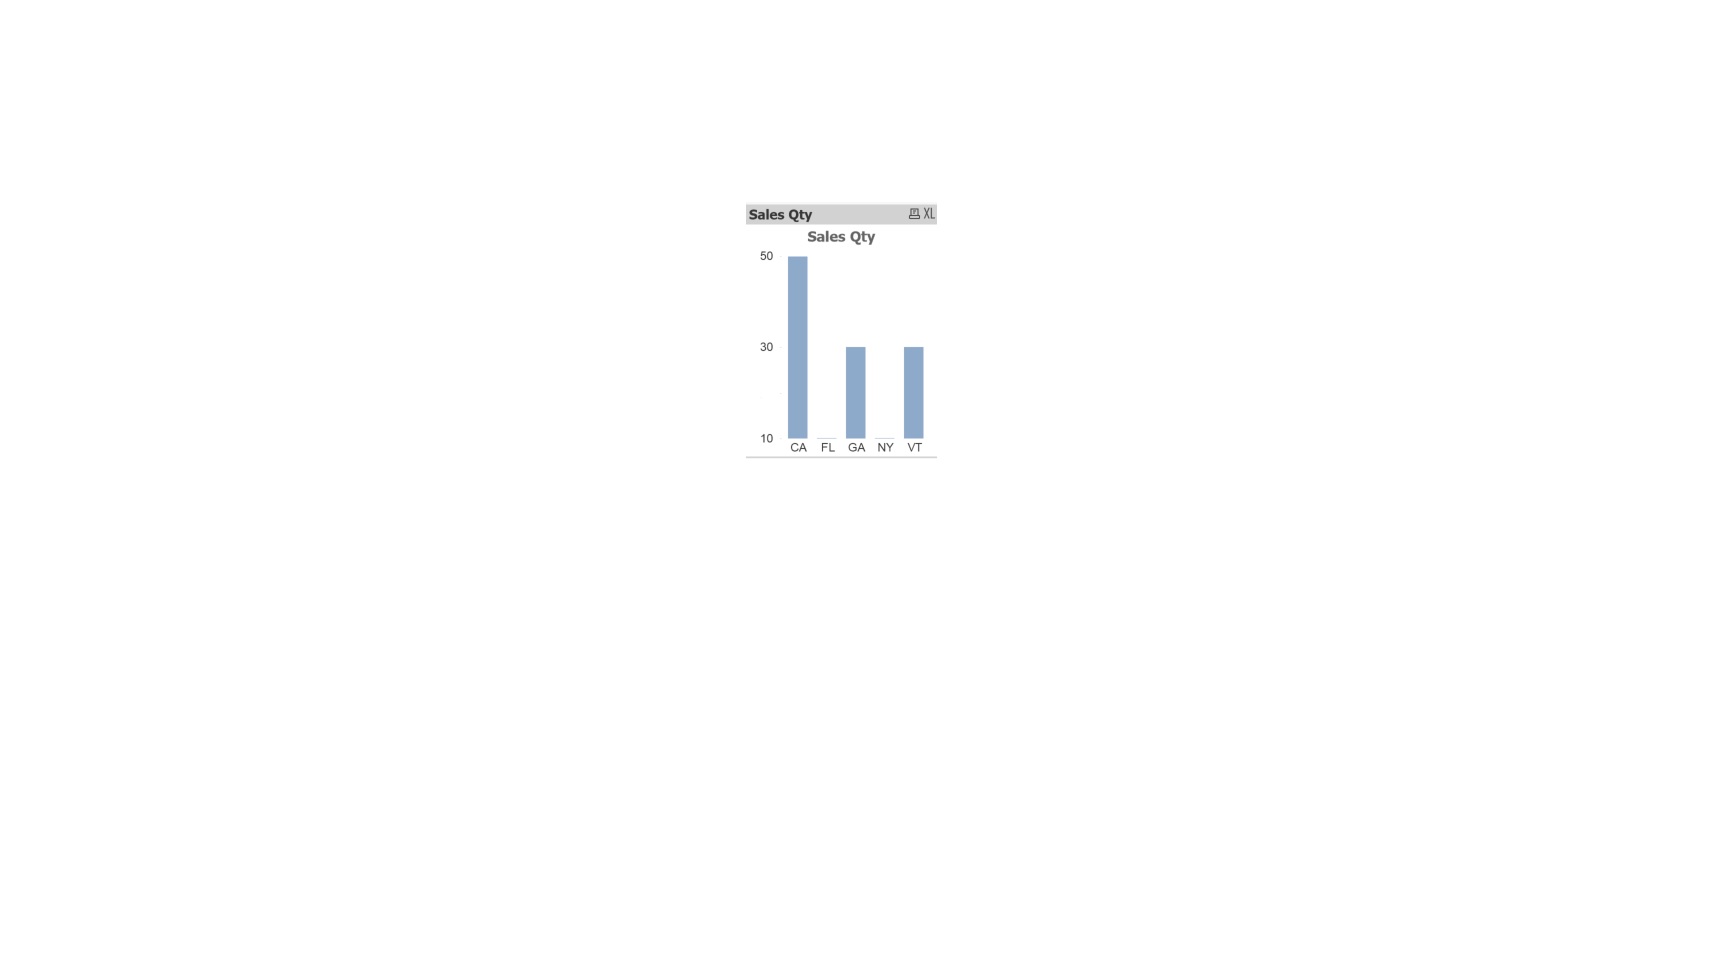
I have sales qty of 10,30,50 as my values for my dimension region. I want my bar chart to show only those values in Y axis.
Currently Y axis shows data points from 10 to 50.
Sample Data:
Region, SalesQty
FL, 10
GA, 30
CA, 50
NY, 10
VT, 30
331 Views
5 Replies
Specialist
2017-05-22
10:10 AM
- Mark as New
- Bookmark
- Subscribe
- Mute
- Subscribe to RSS Feed
- Permalink
- Report Inappropriate Content
Hi,
214 Views
Not applicable
2017-05-22
12:41 PM
Author
- Mark as New
- Bookmark
- Subscribe
- Mute
- Subscribe to RSS Feed
- Permalink
- Report Inappropriate Content
Hi ,
i changed the color but it doesnt hide the values 20 & 40 from Y axis.
i have attached the desired output i am looking for.
214 Views
Champion III
2017-05-22
01:34 PM
- Mark as New
- Bookmark
- Subscribe
- Mute
- Subscribe to RSS Feed
- Permalink
- Report Inappropriate Content
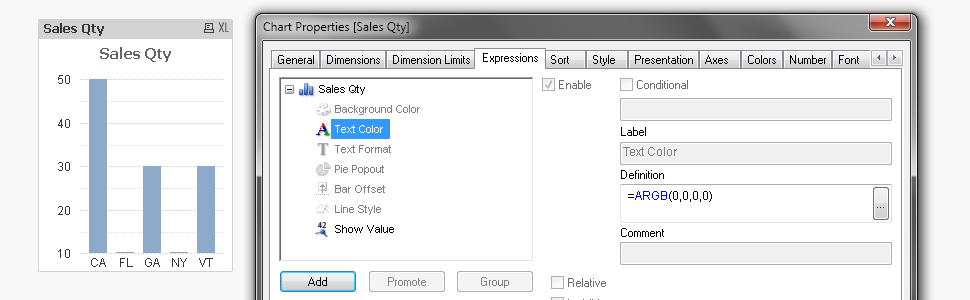
Check this may be?
Expr in Background color.
214 Views
Not applicable
2017-05-22
05:34 PM
Author
- Mark as New
- Bookmark
- Subscribe
- Mute
- Subscribe to RSS Feed
- Permalink
- Report Inappropriate Content
sorry i couldnt open the qvw, what expression do you advise for me to add to background color of expression?
214 Views
Champion III
2017-05-22
05:48 PM
- Mark as New
- Bookmark
- Subscribe
- Mute
- Subscribe to RSS Feed
- Permalink
- Report Inappropriate Content
= IF(Match(Region, 'FL','NY'), White())
214 Views