Unlock a world of possibilities! Login now and discover the exclusive benefits awaiting you.
- Qlik Community
- :
- Forums
- :
- Analytics
- :
- App Development
- :
- Re: Create a calculated Pareto dimension involving...
- Subscribe to RSS Feed
- Mark Topic as New
- Mark Topic as Read
- Float this Topic for Current User
- Bookmark
- Subscribe
- Mute
- Printer Friendly Page
- Mark as New
- Bookmark
- Subscribe
- Mute
- Subscribe to RSS Feed
- Permalink
- Report Inappropriate Content
Create a calculated Pareto dimension involving Select
Hello all, I have a part of the dataset as follows:
Vendor Sales Type Type1 Code
A 1300 C M 1234
B 2200 N S 1235
A 1400 N M 1236
B 2100 N M 1237
C 2500 C M 1240
A 300 N M 1239
C 900 C M 1240
D 3200 N M 1241
B 2000 C S 1242
D 1500 C S 1243
E 1100 N M 1246
F 3500 C M 1245
E 1500 C M 1246
G 1400 N M 1247
H 600 C M 1248
H 900 N S 1249
G 1200 C M 1247
Now if we perform a Pareto analysis on the above data, we see that the Vendors C,E,G and H are in Bottom 20%. Now I'd like to select the records of these Vendors with Type='N' and Type1='M'. So the dataset reduces to:
E 1100 N M 1246
G 1400 N M 1247
Now for these codes in the entire dataset, I'd like to display a stacked bar chart giving the amount Under the type 'C' and 'Top 80% N'(ie, Top 80% Vendors in Pareto among only Vendors in Type N). So the Type C here would display 2700(1500 from E and 1200 from G). The Top 80% N part would display 0 as neither E or G come under Top 80% in the Pareto done on only type 'N'.
If anyone can help me achieve this entire process(right from selecting only data from Bottom 20% of Type1='M' and Type = 'N' to the end) which seems very complicated and is just beyond me at the moment, I'd be really really grateful. TIA!
- « Previous Replies
-
- 1
- 2
- Next Replies »
Accepted Solutions
- Mark as New
- Bookmark
- Subscribe
- Mute
- Subscribe to RSS Feed
- Permalink
- Report Inappropriate Content
Here you are
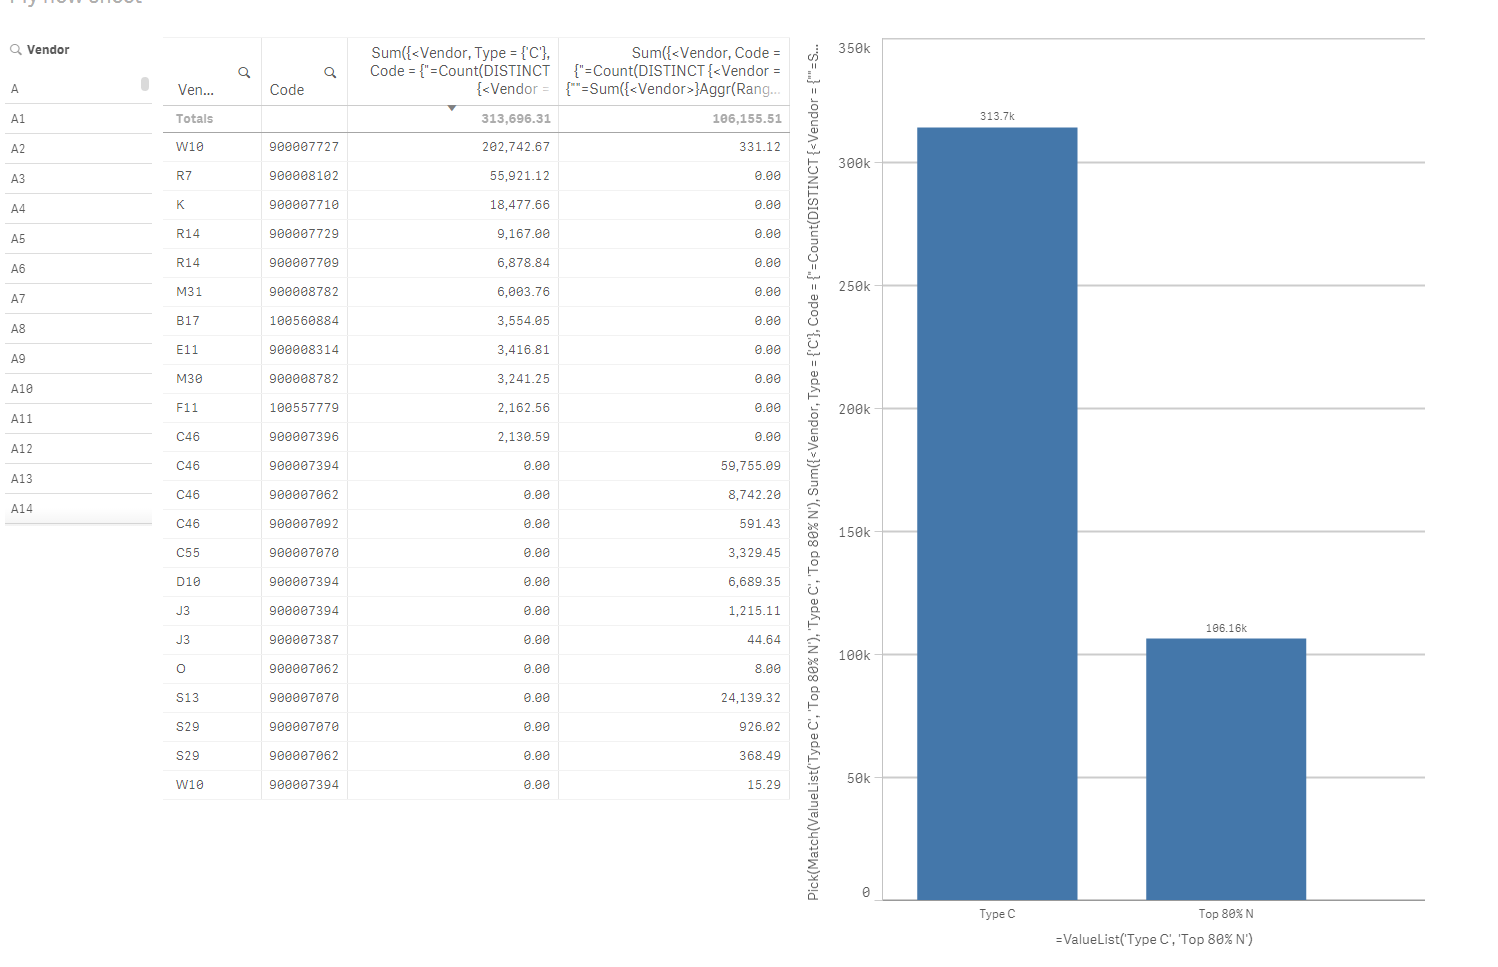
Dimension
=ValueList('Type C', 'Top 80% N')
Expression
Pick(Match(ValueList('Type C', 'Top 80% N'), 'Type C', 'Top 80% N'),
Sum({<Vendor, Type = {'C'},
Code = {"=Count(DISTINCT {<Vendor = {""=Sum({<Vendor>}Aggr(Rangesum(Above(Sum({<Vendor>} Sales)/Sum({<Vendor>} TOTAL Sales), 0, RowNo())), (Vendor,(=Sum({<Vendor>} Sales),Desc)))) >= 0.8""}, Type = {'N'}, Type1 = {'M'}>}Code) >= 1"}>} Sales),
Sum({<Vendor,
Code = {"=Count(DISTINCT {<Vendor = {""=Sum({<Vendor>}Aggr(Rangesum(Above(Sum({<Vendor>} Sales)/Sum({<Vendor>} TOTAL Sales), 0, RowNo())), (Vendor,(=Sum({<Vendor>} Sales),Desc)))) > 0.8""}, Type = {'N'}, Type1 = {'M'}>}Code) >= 1"},
Vendor = {"=Sum({<Vendor>}Aggr(Rangesum(Above(Sum({<Vendor>} Sales)/Sum({<Vendor>} TOTAL Sales), 0, RowNo())), (Vendor,(=Sum({<Vendor>} Sales),Desc)))) <= 0.8"},
Type = {'N'}>} Sales))
Also, please find attached the application with this email.
- Mark as New
- Bookmark
- Subscribe
- Mute
- Subscribe to RSS Feed
- Permalink
- Report Inappropriate Content
Can you post a qvf where this data is already loaded.....
- Mark as New
- Bookmark
- Subscribe
- Mute
- Subscribe to RSS Feed
- Permalink
- Report Inappropriate Content
Hello. Here's the qvf. Hope you understood what I'm trying to achieve. To add to above, let's say there's an extra record:
Vendor Type Type1 Sales Code
A N M 800 1246
As A falls under Top 80% in Pareto among Vendors of type N, the bar chart should display 800 under 'Top 80%N'. Hope that makes it more clear. Thanks again!
- Mark as New
- Bookmark
- Subscribe
- Mute
- Subscribe to RSS Feed
- Permalink
- Report Inappropriate Content
I hope this helps, but I didn't incorporate the 20% part please advice on what we should do because I didn't understand your statement there. I hope the QVF help but if you need more help don't hesitate to ask for help
- Mark as New
- Bookmark
- Subscribe
- Mute
- Subscribe to RSS Feed
- Permalink
- Report Inappropriate Content
Please draw a chart or use simple numbers to drive all your calculations as to show how you get that vendor A is under 80%, not following the logic here at all which makes it hard to help
- Mark as New
- Bookmark
- Subscribe
- Mute
- Subscribe to RSS Feed
- Permalink
- Report Inappropriate Content
Type A part can be accomplished with this
Sum(Aggr(If(Sum(Aggr(
Rangesum(
Above(
Sum({<Vendor, Type = {'N'}, Type1 = {'M'}>} Sales)/
Sum({<Vendor, Type = {'N'}, Type1 = {'M'}>} TOTAL Sales)
, 0, RowNo())
)
, (Vendor,(=Sum({<Vendor, Type = {'N'}, Type1 = {'M'}>} Sales),Desc)))) > 0.8
, Sum({<Vendor, Type = {'C'}>} Sales)),
(Vendor,(=Sum({<Vendor, Type = {'N'}, Type1 = {'M'}>} Sales),Desc))))
Now I understood why Top 80% for Type N was 0 in the first dataset, but what I am not sure is why would adding this row of data change things?
Vendor Type Type1 Sales Code
A N M 800 1246
Does adding this bring this to the bottom 20% with Type='N' and Type1='M'? Because I thought we only need to bring those Vendors which 1st meet this criteria. Is that true for both Type C and Top 80% Type N?
- Mark as New
- Bookmark
- Subscribe
- Mute
- Subscribe to RSS Feed
- Permalink
- Report Inappropriate Content
My bad. I'm sorry for confusing you. What you understood initially was correct. Ignore that line please. I was trying to make something clear but gave a very poor example. Sorry for the trouble.
- Mark as New
- Bookmark
- Subscribe
- Mute
- Subscribe to RSS Feed
- Permalink
- Report Inappropriate Content
And yes we only need to get the Vendors which fall in the bottom 20% from that dataset for both Type C and Top 80% N.
- Mark as New
- Bookmark
- Subscribe
- Mute
- Subscribe to RSS Feed
- Permalink
- Report Inappropriate Content
If you had searched this site, you would have found
Recipe for a Pareto Analysis – Revisited
And quite a few more...
- Mark as New
- Bookmark
- Subscribe
- Mute
- Subscribe to RSS Feed
- Permalink
- Report Inappropriate Content
I believe this should work
Dimension
=ValueList('Type C', 'Top 80% N')
Expression
Pick(Match(ValueList('Type C', 'Top 80% N'), 'Type C', 'Top 80% N'),
Sum({<Vendor = {"=Sum(Aggr(Rangesum(Above(Sum({<Vendor, Type = {'N'}, Type1 = {'M'}>} Sales)/Sum({<Vendor, Type = {'N'}, Type1 = {'M'}>} TOTAL Sales), 0, RowNo())), (Vendor,(=Sum({<Vendor, Type = {'N'}, Type1 = {'M'}>} Sales),Desc)))) > 0.8"}, Type = {'C'}>} Sales),
Sum({<Vendor = {"=Sum(Aggr(Rangesum(Above(Sum({<Vendor, Type = {'N'}, Type1 = {'M'}>} Sales)/Sum({<Vendor, Type = {'N'}, Type1 = {'M'}>} TOTAL Sales), 0, RowNo())), (Vendor,(=Sum({<Vendor, Type = {'N'}, Type1 = {'M'}>} Sales),Desc)))) > 0.8 and Sum(Aggr(Rangesum(Above(Sum({<Vendor, Type = {'N'}>} Sales)/Sum({<Vendor, Type = {'N'}>} TOTAL Sales), 0, RowNo())), (Vendor,(=Sum({<Vendor, Type = {'N'}>} Sales),Desc)))) <= 0.8"}, Type = {'C'}>} Sales))
- « Previous Replies
-
- 1
- 2
- Next Replies »