Unlock a world of possibilities! Login now and discover the exclusive benefits awaiting you.
- Qlik Community
- :
- All Forums
- :
- Deployment & Management
- :
- Position line vertical or current date bold
- Subscribe to RSS Feed
- Mark Topic as New
- Mark Topic as Read
- Float this Topic for Current User
- Bookmark
- Subscribe
- Mute
- Printer Friendly Page
- Mark as New
- Bookmark
- Subscribe
- Mute
- Subscribe to RSS Feed
- Permalink
- Report Inappropriate Content
Position line vertical or current date bold
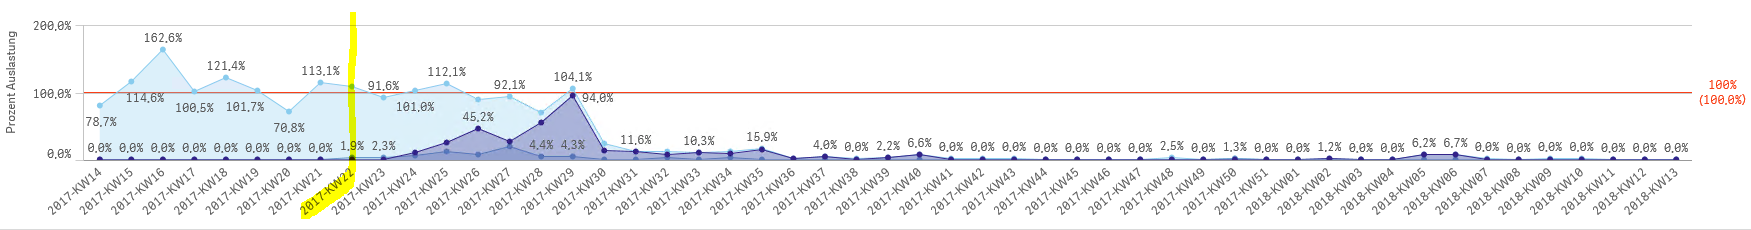
I have a line diagram.
There is a horizontal position line for percent.
Now I would like to add a vertical line for today as week, so can all know directly in which week we are.
Or make the date fat.
How can i do this?
Accepted Solutions
- Mark as New
- Bookmark
- Subscribe
- Mute
- Subscribe to RSS Feed
- Permalink
- Report Inappropriate Content
Hi Martin,
does not exists documentations regarding the client.js file.
The only way to modify the client.js is to debug it with an AngularJs developer.
If a post helps to resolve your issue, please accept it as a Solution.
- Mark as New
- Bookmark
- Subscribe
- Mute
- Subscribe to RSS Feed
- Permalink
- Report Inappropriate Content
There is no possibility to put vertical lines and without modify the client.js you can't bold only one value of a dimension.
If a post helps to resolve your issue, please accept it as a Solution.
- Mark as New
- Bookmark
- Subscribe
- Mute
- Subscribe to RSS Feed
- Permalink
- Report Inappropriate Content
What would then have to be adapted where? Does anyone have experience and can help me?What would then Have to be adapted where?
Does anyone have experience and can help me?
- Mark as New
- Bookmark
- Subscribe
- Mute
- Subscribe to RSS Feed
- Permalink
- Report Inappropriate Content
It's highly not recommended to modify client.js because for non-expert users this can cause lots of complications after an update of QlikSense site.
Sorry Martin but your request isn't achievable nowadays.
If a post helps to resolve your issue, please accept it as a Solution.
- Mark as New
- Bookmark
- Subscribe
- Mute
- Subscribe to RSS Feed
- Permalink
- Report Inappropriate Content
Can I look at this somewhere or is there a manual?
- Mark as New
- Bookmark
- Subscribe
- Mute
- Subscribe to RSS Feed
- Permalink
- Report Inappropriate Content
Hi Martin,
does not exists documentations regarding the client.js file.
The only way to modify the client.js is to debug it with an AngularJs developer.
If a post helps to resolve your issue, please accept it as a Solution.