Unlock a world of possibilities! Login now and discover the exclusive benefits awaiting you.
- Qlik Community
- :
- Forums
- :
- Analytics
- :
- New to Qlik Analytics
- :
- How do you add a U.S. map to a visualization?
- Subscribe to RSS Feed
- Mark Topic as New
- Mark Topic as Read
- Float this Topic for Current User
- Bookmark
- Subscribe
- Mute
- Printer Friendly Page
- Mark as New
- Bookmark
- Subscribe
- Mute
- Subscribe to RSS Feed
- Permalink
- Report Inappropriate Content
How do you add a U.S. map to a visualization?
Hello all,
I've recently started working on a Qlik Sense Desktop application that includes state data. These states are ranked in order of importance and I wanted to display that on a United States map in different colors representing different regions. However, as I tried importing a KML and a color expression, it didn't work. I've heard about GeoAnalytics from Qlik but I'm not sure how that works and would like some assistance on how to create a working map. Thanks again in advance, I appreciate any help!
Sincerely,
Debashish
- Mark as New
- Bookmark
- Subscribe
- Mute
- Subscribe to RSS Feed
- Permalink
- Report Inappropriate Content
Hello!
You can import any KML into Qlik Sense; just read it as you would any normal flat file.
KMLs are easily found online. I downloaded one from:
https://developers.google.com/kml/documentation/us_states.kml
When you read it, you get the following code in the Script Editor:
LOAD [us_states.Name],
[us_states.Point],
[us_states.Area]
FROM [lib://KML/us_states.kml]
(kml, Table is [US States]);
In this particular KML, the states are named:
Alabama (1819)
Alaska (1959)
Arizona (1912)
... and so on.
Now you have to associate the [us_states.Name] field with the state field in you data. I usually do this by building a translation table in Excel, that matches both names.
This table would look like:
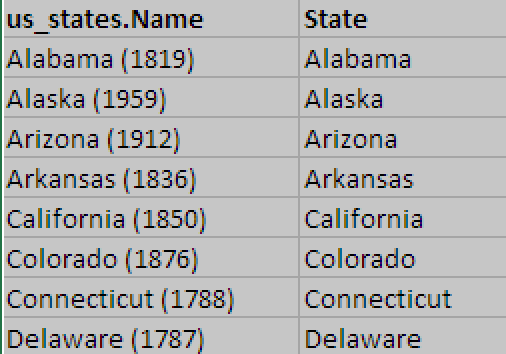
By adding this translation table to your app, you now have a 1:1 relationship between your states and the corresponding KML row.
This will give you a working map of the U.S. that you can color as you wish.
Hope this helps!
- Mark as New
- Bookmark
- Subscribe
- Mute
- Subscribe to RSS Feed
- Permalink
- Report Inappropriate Content
Thank you! That was very insightful and I have a direction on how to proceed. However, I'm not sure how you would create a translator table as it is a KML file, so I'm not sure how I can write in the associated state name. Any help on building that translation table would be wonderful, thank you very much again!
- Mark as New
- Bookmark
- Subscribe
- Mute
- Subscribe to RSS Feed
- Permalink
- Report Inappropriate Content
To create a translator table:
1. Read the KML into an app.
2. Enter Edit Mode, Create a Filter pane for the KLM State Name field ([us_states.Name] in my example above), and exit Edit Mode.
3. Right-click the filter pane to Export Data
4. Open the exported data in Excel
5. Repeat steps 1-4 for your own State Name Field
6. Copy both exported data columns into the same Excel sheet, and make sure the names match.
7. Save the Excel file.
8. Add this as a new table into your app.
I think that's it! Let us know if it works.