Unlock a world of possibilities! Login now and discover the exclusive benefits awaiting you.
- Qlik Community
- :
- All Forums
- :
- QlikView App Dev
- :
- Re: Put unstructured text in columns
- Subscribe to RSS Feed
- Mark Topic as New
- Mark Topic as Read
- Float this Topic for Current User
- Bookmark
- Subscribe
- Mute
- Printer Friendly Page
- Mark as New
- Bookmark
- Subscribe
- Mute
- Subscribe to RSS Feed
- Permalink
- Report Inappropriate Content
Put unstructured text in columns
Hi,
I have data in the following format in one of the columns in my table
Area : CXX |
I need to put all this information in different columns to eavluate the data. The Summary bit also needs to be sliced to give groups Like Average response time, time in queues, address of component etc. The length and format of summary are variable and it is a large file. Any suggestions on how to approach this problem?
Many thanks!
- Tags:
- qlikview_scripting
Accepted Solutions
- Mark as New
- Bookmark
- Subscribe
- Mute
- Subscribe to RSS Feed
- Permalink
- Report Inappropriate Content
Piece of cake.
1. Split the lines into individual rows using Subtring(Input, chr(10))
2. Use a Generic Load to transform the "fieldname : value" pairs into fields.
3. The SummaryMetrics load below gives an example of parsing the summary string. You indicated there may be more metrics in the Summary, you could build out the example.
Input:
Directory;
LOAD RecId,
subField(Raw, chr(10)) as Element
FROM
RawData.xlsx
(ooxml, embedded labels, table is Sheet1);
Fields:
Generic
LOAD
RecId,
Trim(SubField(Element, ':', 1)),
Trim(SubField(Element, ':', 2))
Resident Input
Where NOT Element LIKE 'Summary*'
;
SummaryMetrics:
LOAD
RecId,
TextBetween(Element, 'is ', 'seconds') as AvgResp
Resident Input
Where Element LIKE 'Summary*Avg_Response_Time*'
;
DROP TABLE Input;
| RecId | Spot | Component | Area | Application | AvgResp |
|---|---|---|---|---|---|
| 1 | xyz42i | xyz42i | CXX | Happy | 1.54 |
-Rob
- Mark as New
- Bookmark
- Subscribe
- Mute
- Subscribe to RSS Feed
- Permalink
- Report Inappropriate Content
Cool way to do it Rob.
Makes it really easy and clean to do it.
- Mark as New
- Bookmark
- Subscribe
- Mute
- Subscribe to RSS Feed
- Permalink
- Report Inappropriate Content
Hi Rob,
Many thanks for your help. I tried using it and it does give me fields like in the picture. But how should I get them to show up in the main sheet? Sorry I am very new to this.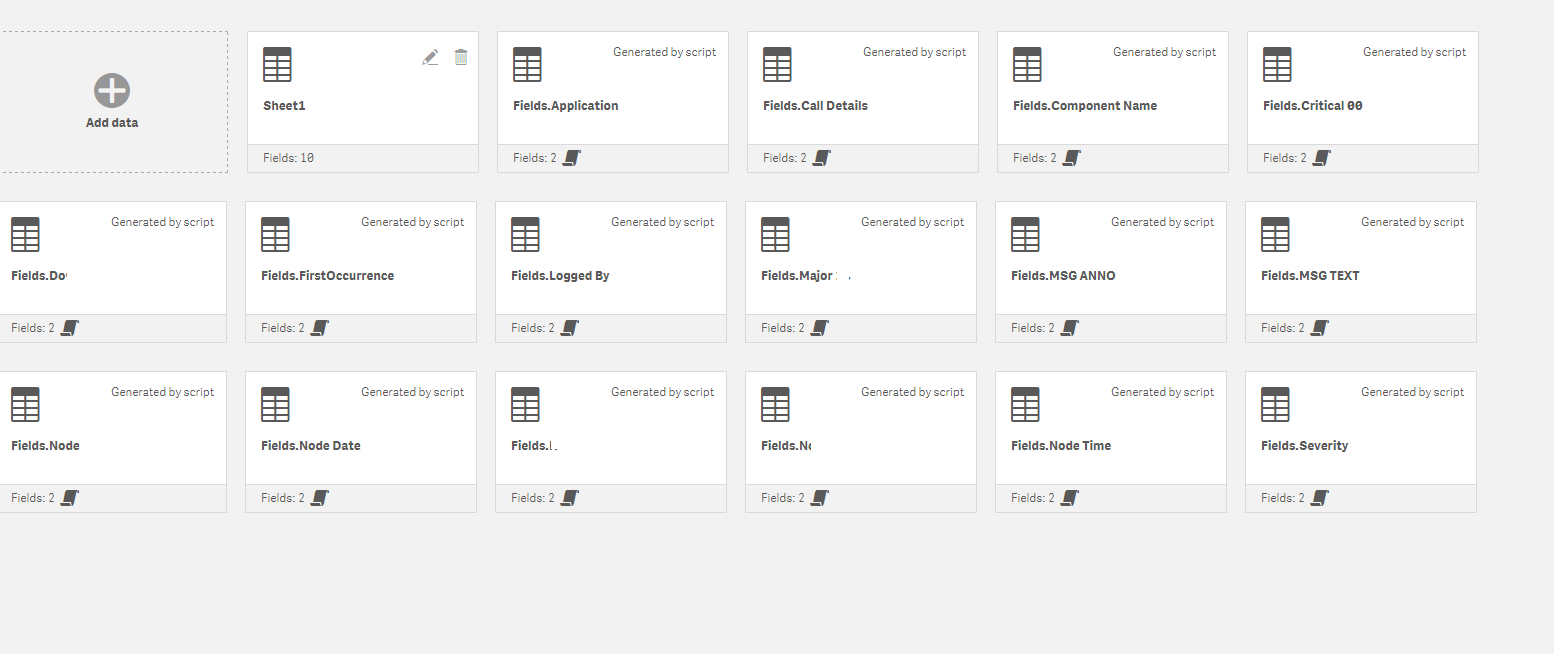
- Mark as New
- Bookmark
- Subscribe
- Mute
- Subscribe to RSS Feed
- Permalink
- Report Inappropriate Content
That is the table model you are posting. To view the data on a sheet, you will need to create a visualization such as a table on the sheet. Try adding a few of the fields to a Table object on the sheet.
-Rob