Unlock a world of possibilities! Login now and discover the exclusive benefits awaiting you.
- Qlik Community
- :
- All Forums
- :
- QlikView App Dev
- :
- Re: Seprate positive and negative values in Bar ch...
- Subscribe to RSS Feed
- Mark Topic as New
- Mark Topic as Read
- Float this Topic for Current User
- Bookmark
- Subscribe
- Mute
- Printer Friendly Page
- Mark as New
- Bookmark
- Subscribe
- Mute
- Subscribe to RSS Feed
- Permalink
- Report Inappropriate Content
Seprate positive and negative values in Bar chart
Hello Everyone,
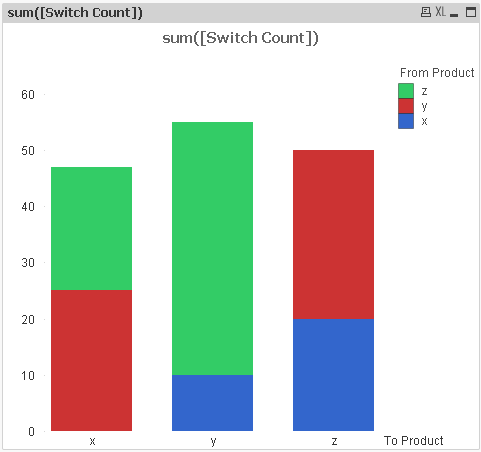
I want to show positive and negative values in bar chart.
I have attached sample qvw
here if I select N_Flag=0 it gives me positive values in chart
select N_Flag=1 it gives me negative values in chart
If I do not select N_Flag= it calculates net values(which I do not want)
My requirement is to display positive and negative values in single chart.

Please suggest if there is any solution.
Regards,
Sabahat
- Tags:
- qlikview
- « Previous Replies
-
- 1
- 2
- Next Replies »
- Mark as New
- Bookmark
- Subscribe
- Mute
- Subscribe to RSS Feed
- Permalink
- Report Inappropriate Content
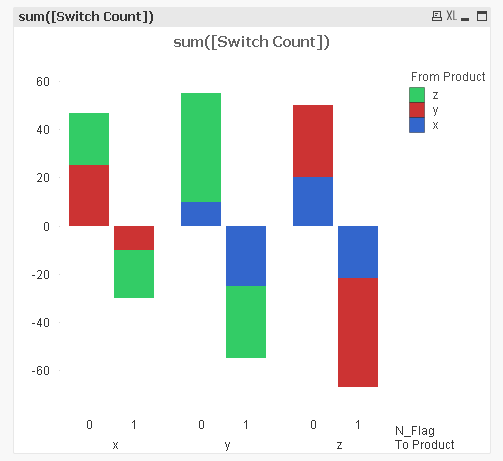
Not sure if this is the best way to do this, but what if you add N_Flag as your second dimension here
- Mark as New
- Bookmark
- Subscribe
- Mute
- Subscribe to RSS Feed
- Permalink
- Report Inappropriate Content
Thanks Sunny for your quick reply.
But I need one bar for each 'To Product'.
Is there any other workaround?
- Mark as New
- Bookmark
- Subscribe
- Mute
- Subscribe to RSS Feed
- Permalink
- Report Inappropriate Content
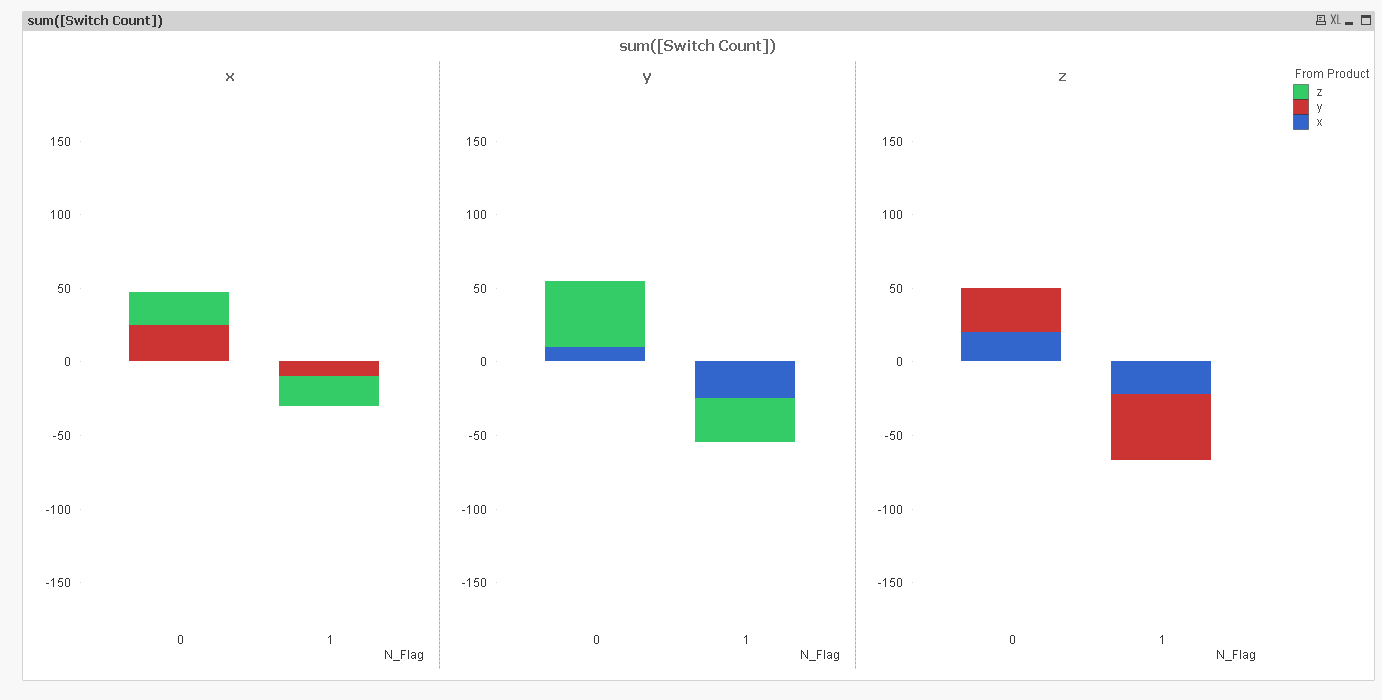
Something like this?
- Mark as New
- Bookmark
- Subscribe
- Mute
- Subscribe to RSS Feed
- Permalink
- Report Inappropriate Content
Like below

- Mark as New
- Bookmark
- Subscribe
- Mute
- Subscribe to RSS Feed
- Permalink
- Report Inappropriate Content
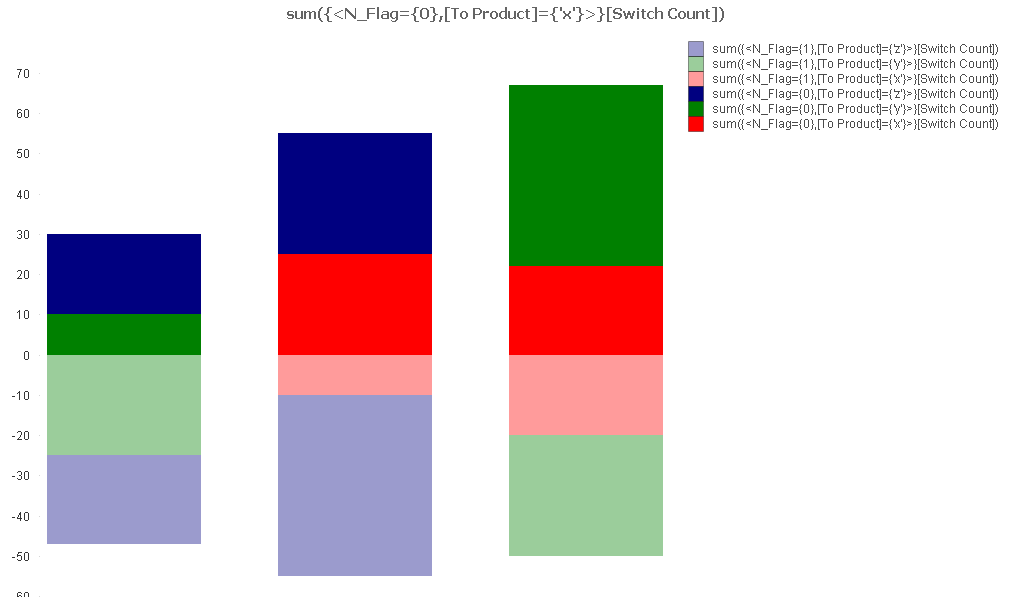
Yes you can, just add one expression for each segment
Check the attached
If a post helps to resolve your issue, please accept it as a Solution.
- Mark as New
- Bookmark
- Subscribe
- Mute
- Subscribe to RSS Feed
- Permalink
- Report Inappropriate Content
sample app
If a post helps to resolve your issue, please accept it as a Solution.
- Mark as New
- Bookmark
- Subscribe
- Mute
- Subscribe to RSS Feed
- Permalink
- Report Inappropriate Content
May be try this
- Mark as New
- Bookmark
- Subscribe
- Mute
- Subscribe to RSS Feed
- Permalink
- Report Inappropriate Content
Thanks Vineet.
Good Suggestion. But Number of products are not fixed ,they could increase in future. So in such case ,this approach wont work.
- Mark as New
- Bookmark
- Subscribe
- Mute
- Subscribe to RSS Feed
- Permalink
- Report Inappropriate Content
Hi Sunny,
For butterfly chart ,need to bring the data in format as given in attached example.
Can consider this option if we can format the data .
Thanks for your Suggestion!!
- « Previous Replies
-
- 1
- 2
- Next Replies »