Unlock a world of possibilities! Login now and discover the exclusive benefits awaiting you.
- Qlik Community
- :
- All Forums
- :
- QlikView App Dev
- :
- Re: Forecast Calculation
- Subscribe to RSS Feed
- Mark Topic as New
- Mark Topic as Read
- Float this Topic for Current User
- Bookmark
- Subscribe
- Mute
- Printer Friendly Page
- Mark as New
- Bookmark
- Subscribe
- Mute
- Subscribe to RSS Feed
- Permalink
- Report Inappropriate Content
Forecast Calculation
Hello,
Is there a standard procedure for calculating a forecast of sales by extrapolation (accrued revenues diviert by expired months, then multiplied by months left till yearend )
for example: sales till this month November is 2 millions, so every month = 200.000, Extrapolation ist then
November : 2,2 millions
December : 2,4 millions
If there is a Standard procedure, can I build it in the loadstatement of my Measure Sales????
- Tags:
- qlikview_scripting
- « Previous Replies
-
- 1
- 2
- Next Replies »
- Mark as New
- Bookmark
- Subscribe
- Mute
- Subscribe to RSS Feed
- Permalink
- Report Inappropriate Content
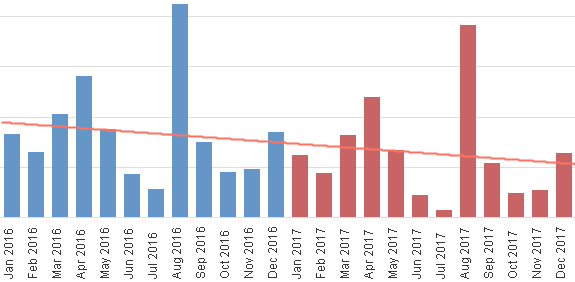
If I've understood, see below and attached. I'm now forecasting the next 12 months instead of next 6, because otherwise we can't visually see the relationship of the seasonal changes to the 12 month trend. You can use any number of months you want, it just makes it hard to visually verify that you have the right results. For a single Branch and Product and 12 months forecasted, you should see each forecasted month be the same distance from the trend line as the same month in the previous year. Well, except that I've assumed we can't have negative sales, so we don't go below 0, even if that's what the seasonal trend suggests.
Temp:
NOCONCATENATE
LOAD
Branch
,Product
,Month
,sum(Sales) as Sales
RESIDENT Data
WHERE Month >= monthstart(today(),-12)
GROUP BY
Branch
,Product
,Month
;
LEFT JOIN (Temp)
LOAD
Branch
,Product
,linest_m(Sales,Month) as Slope
RESIDENT Temp
GROUP BY
Branch
,Product
;
CONCATENATE (Data)
LOAD
Branch
,Product
,addmonths(Month,12) as Month
,rangemax(0,Sales+(addmonths(Month,12)-Month)*Slope) as Sales
,'Forecast' as Type
RESIDENT Temp
;
DROP TABLE Temp;
- Mark as New
- Bookmark
- Subscribe
- Mute
- Subscribe to RSS Feed
- Permalink
- Report Inappropriate Content
Hii John,,
One more time, thank you for your reply and help.
Regards
BJ
- Mark as New
- Bookmark
- Subscribe
- Mute
- Subscribe to RSS Feed
- Permalink
- Report Inappropriate Content
How can I calculate and apply a linear regression to see the balance of future dates?
From the data shown in the Excel of the link, I must calculate with the methodology of linear regression of future dates, the real is from 28/02/2017 backwards and future dates 01/03/2017 forward and the amounts They are zero, I need to Replace it with the projection, if you can help me I thank you.
What I would like to do is select a date from 2018 and be able to see the value of the projection. Is this possible in the load?
Regards,
- Mark as New
- Bookmark
- Subscribe
- Mute
- Subscribe to RSS Feed
- Permalink
- Report Inappropriate Content
I know its an old one, but could You please explain why for seasonal forecast calculation You use only slope (linest_m) and not intercept (linest_b)?
- Mark as New
- Bookmark
- Subscribe
- Mute
- Subscribe to RSS Feed
- Permalink
- Report Inappropriate Content
Hi!
How can i use this code, but separate by category?
why does this doesn't work? (I added category ID from fact table)
LOAD
monthstart(Date(today()),iterno()-1) as SaleMonth,
monthstart(Date(today()),iterno()-1)*Slope+Intercept as Sales,
'Forecast' as sale_type
WHILE iterno() <= 6;
LOAD
linest_m(Sales,SaleMonth) as Slope,
linest_b(Sales,SaleMonth) as Intercept;
LOAD
SaleMonth,
CategoryID,
sum(Sales) as Sales
Resident Fact_Sales
WHERE SaleMonth >= monthstart(Date(today()),-6) and CANCEL_FLAG <> 'Y'
GROUP BY SaleMonth,CategoryID;
- Mark as New
- Bookmark
- Subscribe
- Mute
- Subscribe to RSS Feed
- Permalink
- Report Inappropriate Content
I have two Years of Data 2017 and 2018 for each 12 month. i want to predict next year sales in each month. can u help me how to forecast next year sales in each month.
- Mark as New
- Bookmark
- Subscribe
- Mute
- Subscribe to RSS Feed
- Permalink
- Report Inappropriate Content
Dear John
Thanks for your Suggestion. I have tried following script but still i don't know where am missing.
I do have attached the screen shot of chart and also script i have tried.
Am getting values for only the data for actual month not for the forecasting month.
Kindly Help me out with this.
Script:
DataLoad:
LOAD [Party Name],
Product,
[Item Name],
Jan,
Feb,
Mar,
Apr,
May,
Jun,
Jul,
Aug,
Sep,
Oct,
Nov,
Dec
FROM
[D:\File\Sales - CHENNAI.xlsx]
(ooxml, embedded labels, table is [CHN - July]);
Transform:
CrossTable(Month,Sales,3)
Load *
Resident DataLoad;
FinalData:
NoConcatenate
LOAD [Party Name],
Product,
[Item Name],
Date#(Month,'MMM') As Month,
'2019' As Year,
Sales
Resident Transform
;
Data:
Load
[Party Name],
Product,
[Item Name],
Month,
Month&' '&Year As Month_Year,
// Month,
Num_Month,Type,
Sales
;
LOAD
[Party Name],
Product,
[Item Name],
Month,
Date#(Year,'YYYY') As Year,
NUM(Month(Month)) As Num_Month,
'Actual' As Type,
Sales
RESIDENT FinalData;
CONCATENATE (Data)
LOAD
[Party Name],
Product,
[Item Name],
// Month
monthstart(today(),iterno()-1) as Month_Year
,monthstart(today(),iterno()-1)*Slope+Intercept as Sales
,'Forecast' as Type
WHILE iterno() <= 6
;
LOAD
[Party Name],
Product,
[Item Name]
,linest_m(Sales,Month_Year) as Slope
,linest_b(Sales,Month_Year) as Intercept
GROUP BY
[Party Name],
Product,
[Item Name]
;
LOAD
[Party Name],
Product,
[Item Name],
Month_Year,
// Num_Month,
Sum(Sales) As Sales
RESIDENT Data
WHERE Month_Year >= monthstart(today(),-12)
GROUP BY
[Party Name],
Product,
[Item Name],
Month_Year
//Num_Month
;
Types:
LOAD *
,rgb(R,G,B) as Color
INLINE [
Type,R,G,B
Actual,100,150,200
Forecast,200,100,100
];
Drop Table FinalData;
Drop Table Transform;
Drop Table DataLoad;
EXIT SCRIPT;

Vignesh Kumar
- « Previous Replies
-
- 1
- 2
- Next Replies »