Unlock a world of possibilities! Login now and discover the exclusive benefits awaiting you.
- Qlik Community
- :
- Forums
- :
- Analytics
- :
- New to Qlik Analytics
- :
- Re: Advance set analysis + histogram as selection ...
- Subscribe to RSS Feed
- Mark Topic as New
- Mark Topic as Read
- Float this Topic for Current User
- Bookmark
- Subscribe
- Mute
- Printer Friendly Page
- Mark as New
- Bookmark
- Subscribe
- Mute
- Subscribe to RSS Feed
- Permalink
- Report Inappropriate Content
Advance set analysis + histogram as selection (sense)
Hi,
In general my case regards the situation that I want to rank one observation in the table with all other observation (let's call benchmark observation: "user", all other observations: "the remaining set") based on one certain numerical field. What is more I want the 'user' observation to be independent to all selections and "the remaining set" should react specifically on the selection I make on the dashboard.
Coming to the details:
1. This is my data set:
LOAD * INLINE [
ID, Category, value, value2, year
1, XXX,10,1241,2014
2, XXX,12,1242,2014
3, YYY,15,1234,2014
4, YYY,14,1123,2014
5, AAA,16,1431,2014
6, User,18,1461,2014
7, AAA,20,1543,2014
8, YYY,21,1412,2014
9, XXX,22,1651,2014
10, AAA,23,1566,2014
1, XXX,22,1561,2015
2, XXX,141,1234,2015
3, YYY,215,1654,2015
4, YYY,124,1561,2015
5, AAA,135,1562,2015
6, User,177,1547,2015
7, AAA,202,1785,2015
8, YYY,221,1652,2015
9, XXX,225,1564,2015
10, AAA,236,1566,2015
];
The "user" observation is defined by the Category='User', "the remaining set" are all the rest observation.
Let's create table which with all the dimensions as given fields in the data table. Let's create the filter pane based on Category.
2. First selection criteria: filter pane Category
a) The first assumption is that I would like to choose only the observations for 2014 year, so my measure in the table is:
sum({$<year={'2014'}> +<Category={'User'},year={'2014'} >} value)
I choose all the observations from "the remaining set" and my "User", it works well with the selection made on filter pane Category as User will always appear no matter what I choose on filter pane. (it works well so far)
b) The second thing is that I would like to apply ranking over the field: "value". So let's say I would like to know what is the ranking of my User versus the selected "Remaining set", I select my "Remaining set" based on Category filter pane.
aggr(rank(sum({$ <year={'2014'}> + <Category={'User'},year={'2014'} >} value)), year, ID)
When I applied this it worked well if I did not choose any filter on my Category filter pane, but if I choose for instance category 'XXX' (so that the Reaming set should be limited to Category/Categories I select) I do not see the ranking of my User any more. I read this blog: Set Analysis in the Aggr function
and figured out I need to apply the external set analysis for my aggregation function so I applied it like this:
sum({$ <year={'2014'}> + <Category={'User'},year={'2014'} >}
aggr(rank(sum({$ <year={'2014'}> + <Category={'User'},year={'2014'} >} value)), year, ID))
The above mentioned function sum i treat only to trick qlik. With the outer set analysis I see my ranking (it works well ).
c) Now I would like to modify my filter pane, so that it contains all the values except the User. I do not want to show User in the filter pane as it is obvious that User should always be selected.
I used the following function to create virtual table so that filter pane dimension is as follows
Aggr(Only({1<Category-={'User'}>} Category), Category)
It works well.
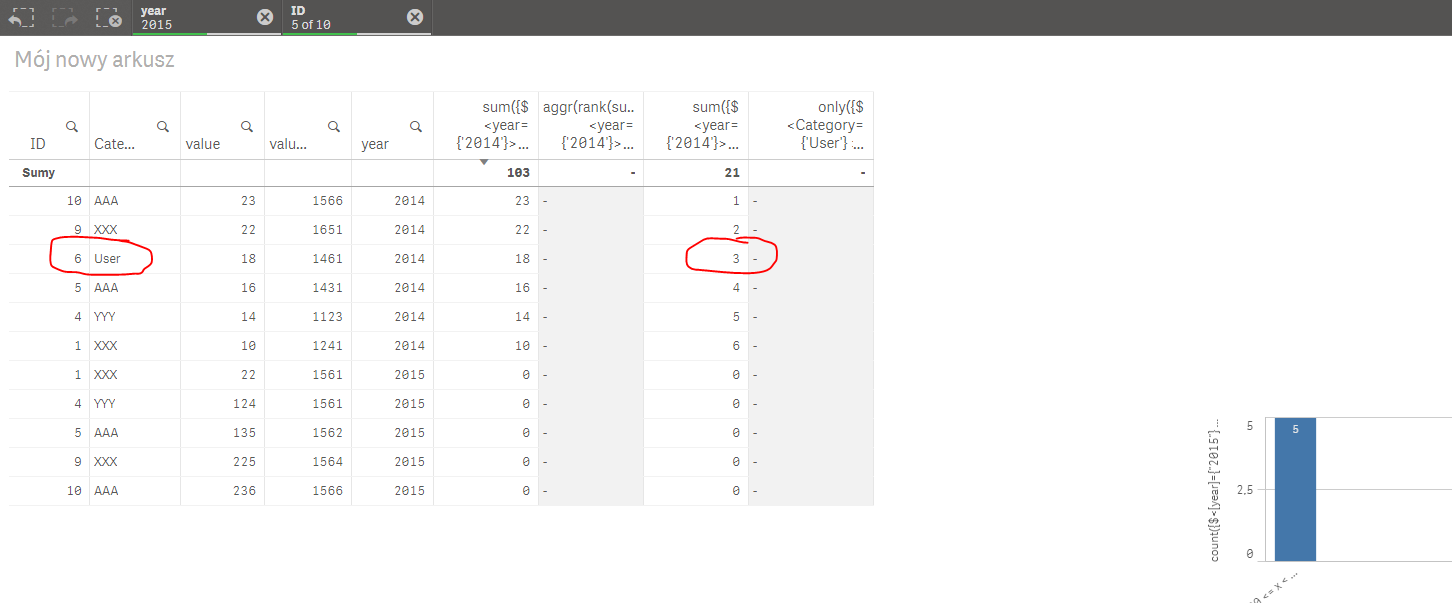
3. Second selection criteria: histogram (here is the case).
Now I would like to add the histogram, and based on selecting its bars to further define the "Remaining set". I cannot figure it how to do it.
The histogram is based on value2 field and year=2015.
The dimension of the histogram is : aggr(class(sum({$<[year]={"2015"}, Category-={'User'}>} value2),100), year, ID)
The measure of the histogram is: count({$<[year]={"2015"},Category-={'User'}>} distinct [ID])
When I click on particular bar on histogram then I see that following selections are made:
Year=2015 (it is the problem as it is not the year used in the ranking)
IDs= Ids from selected bar. (let's assume it is e.g. 1,3,5)
What I would like to do is to capture these IDs, store them and use them in the set analysis so that the "Remaining set" would be limited to 1,3,5. Something like this:
sum({$ <year={'2014'}, selected Bank IDs> + <Category={'User'},year={'2014'} >}
aggr(rank(sum({$ <year={'2014'},selected Bank IDs>> + <Category={'User'},year={'2014'} >} value)), year, ID))
I tried with many things regarding set analysis:
- operators,
- getfieldselection/getcountselection with variable etc,
- ignoring everthing with {1} and setting defined selection with p() functionality but not succesfully.
Any help appreciated!
Accepted Solutions
- Mark as New
- Bookmark
- Subscribe
- Mute
- Subscribe to RSS Feed
- Permalink
- Report Inappropriate Content
Try this
sum({$ <year={'2014'}> + <Category={'User'},year={'2014'}, ID>}
aggr(rank(sum({$ <year={'2014'}> + <Category={'User'},year={'2014'}, ID>} value)), year, ID))
- Mark as New
- Bookmark
- Subscribe
- Mute
- Subscribe to RSS Feed
- Permalink
- Report Inappropriate Content
When I click on particular bar on histogram then I see that following selections are made:
Year=2015 (it is the problem as it is not the year used in the ranking)
IDs= Ids from selected bar. (let's assume it is e.g. 1,3,5)
What I would like to do is to capture these IDs, store them and use them in the set analysis so that the "Remaining set" would be limited to 1,3,5. Something like this:
Isn't this what it is doing already?
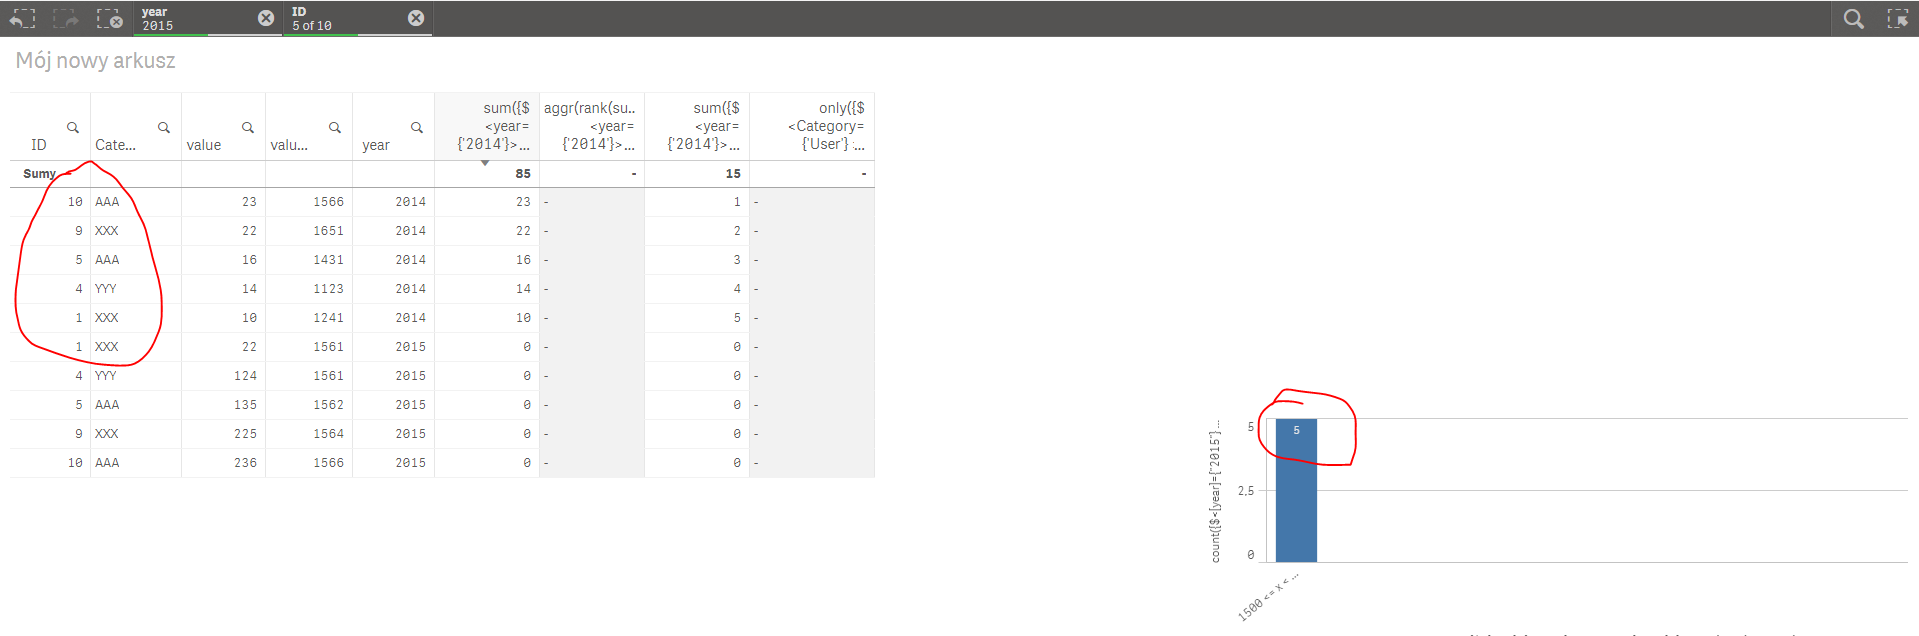
Showing 5 IDs which are available after selection in the bar chart?
- Mark as New
- Bookmark
- Subscribe
- Mute
- Subscribe to RSS Feed
- Permalink
- Report Inappropriate Content
It should also consider Category="User" (as Filter Pane does).
- Mark as New
- Bookmark
- Subscribe
- Mute
- Subscribe to RSS Feed
- Permalink
- Report Inappropriate Content
Try this
sum({$ <year={'2014'}> + <Category={'User'},year={'2014'}, ID>}
aggr(rank(sum({$ <year={'2014'}> + <Category={'User'},year={'2014'}, ID>} value)), year, ID))
- Mark as New
- Bookmark
- Subscribe
- Mute
- Subscribe to RSS Feed
- Permalink
- Report Inappropriate Content
Great!, It works perfectly. I was trying some similar things but needed to confuse something (added ID both to first and second component to set analysis) and no result was given at the end. So once again thanks for the solution. By the way could you explain me whether there is any difference in the following codes:
1 .
sum({$ <year={'2014'}> + <Category={'User'},year={'2014'}, ID>}
aggr(rank(sum({$ <year={'2014'}> + <Category={'User'},year={'2014'}, ID>} value)), year, ID))
2.
sum({$ <year={'2014'}> + <Category={'User'},year={'2014'}, ID=>}
aggr(rank(sum({$ <year={'2014'}> + <Category={'User'},year={'2014'}, ID=>} value)), year, ID))
3.
sum({$ <year={'2014'}> + <Category={'User'},year={'2014'}, ID={*}>}
aggr(rank(sum({$ <year={'2014'}> + <Category={'User'},year={'2014'}, ID={*}>} value)), year, ID))
4.
sum({$ <year={'2014'}> + <Category={'User'},year={'2014'}, ID=p(ID)>}
aggr(rank(sum({$ <year={'2014'}> + <Category={'User'},year={'2014'}, ID=p(ID)>} value)), year, ID))
Best,Maciej
- Mark as New
- Bookmark
- Subscribe
- Mute
- Subscribe to RSS Feed
- Permalink
- Report Inappropriate Content
1 and 2 are the same thing (no difference whatsoever). 3 can give you a different result based on null values in ID. {*} won't include nulls, but if you don't have nulls, then 1, 2, and 3 will give the same result.
4 is completely difference, it is saying show only the possible values of ID. So, this isn't ignoring the selection. In other words, in most cases, ID = P(ID) will be the equivalent of not having that in your expression. There are few cases, when it isn't... for example if you use {1<ID = P(ID)>}... here you ignore selection in every single thing except for allowing for possible values of ID. There are few other scenarios, but those get slight more complex.
HTH
Best,
Sunny