Unlock a world of possibilities! Login now and discover the exclusive benefits awaiting you.
- Qlik Community
- :
- All Forums
- :
- QlikView App Dev
- :
- Re: Line chart
- Subscribe to RSS Feed
- Mark Topic as New
- Mark Topic as Read
- Float this Topic for Current User
- Bookmark
- Subscribe
- Mute
- Printer Friendly Page
- Mark as New
- Bookmark
- Subscribe
- Mute
- Subscribe to RSS Feed
- Permalink
- Report Inappropriate Content
Line chart
Hello All,
I am having a scenario where one value from X Axis is having multiple value and I want to show to in Line Chart separately.
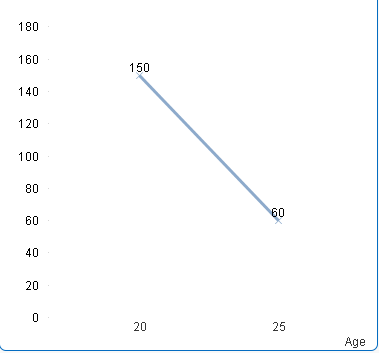
For example, In attached application, for age 20 and 25 multiple weight information is available. Here I was to show both value on the line chart for age 20 and 25.
Kindly suggest a solution.
Regards,
Imran Khan
- Mark as New
- Bookmark
- Subscribe
- Mute
- Subscribe to RSS Feed
- Permalink
- Report Inappropriate Content
How would you do in a Line-Chart? Which values should be linked with which?
You may wish to have a look into Scatter-Charts, allowing to display multiple points per x- or per y-value.
Edith says that Henrik has created a nice How-To: Creating a Scatter Chart
- Mark as New
- Bookmark
- Subscribe
- Mute
- Subscribe to RSS Feed
- Permalink
- Report Inappropriate Content
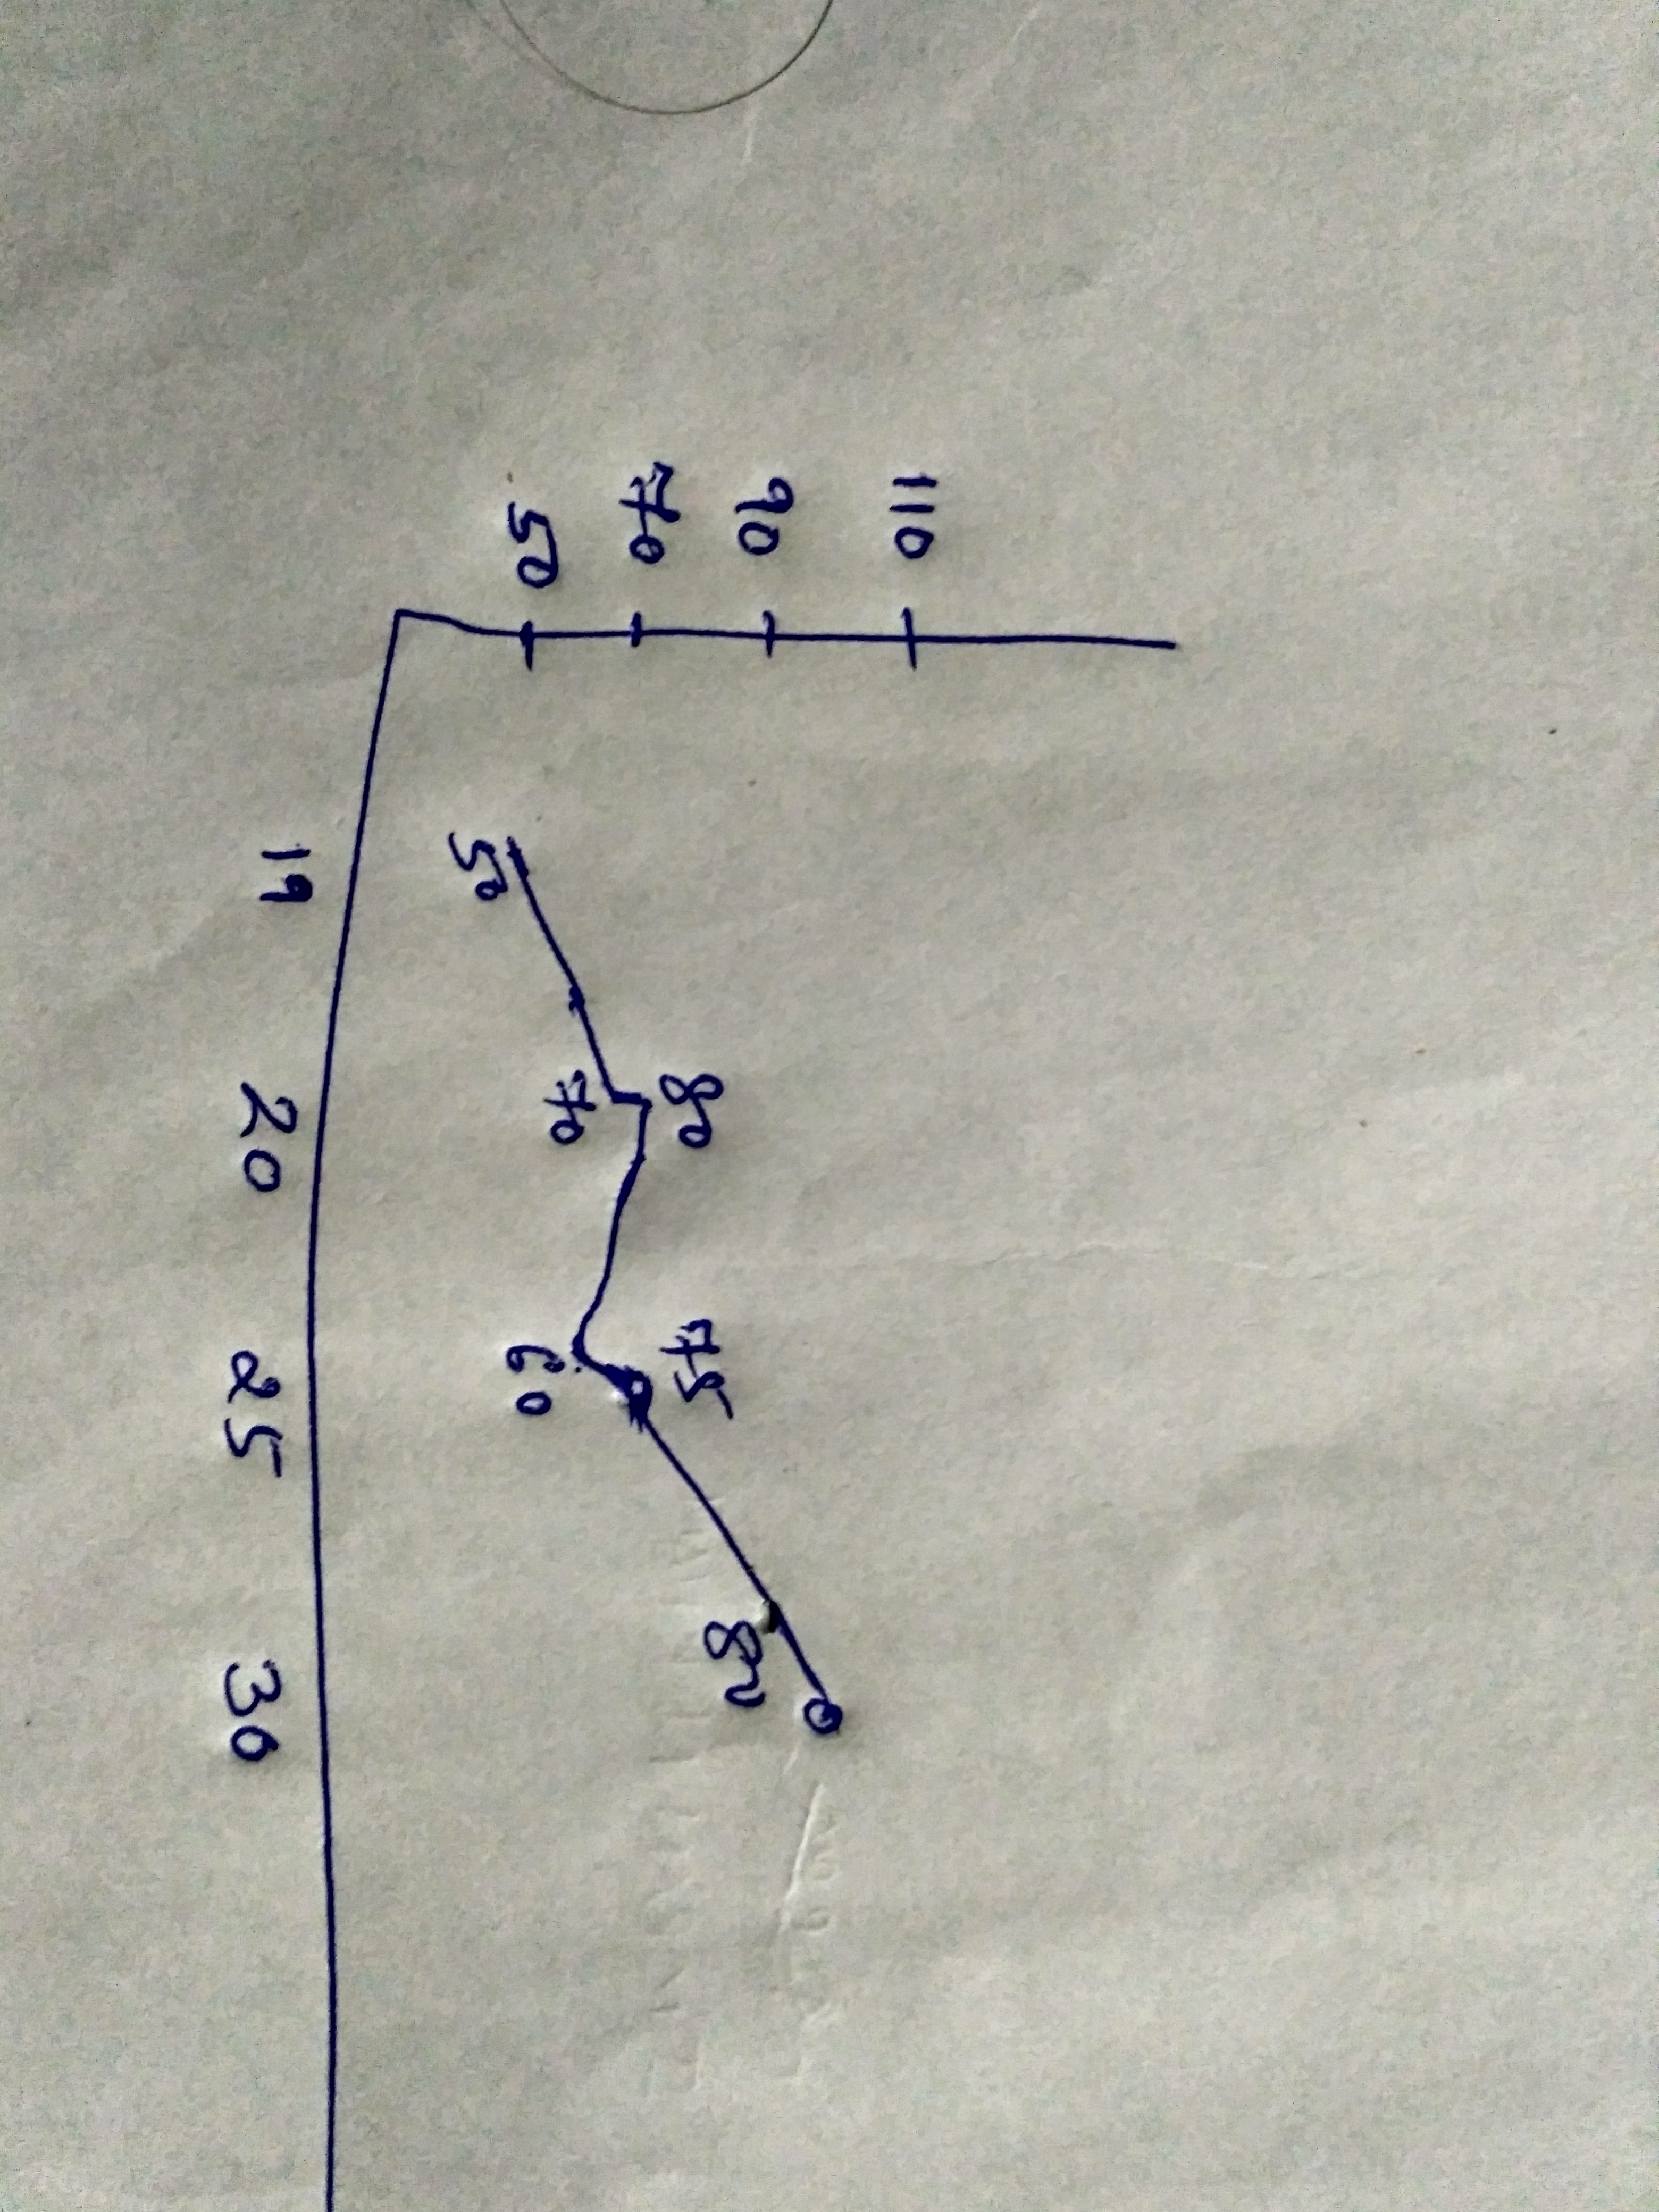
Like this?
- Mark as New
- Bookmark
- Subscribe
- Mute
- Subscribe to RSS Feed
- Permalink
- Report Inappropriate Content
hi please watch this video class function concept which may help
- Mark as New
- Bookmark
- Subscribe
- Mute
- Subscribe to RSS Feed
- Permalink
- Report Inappropriate Content
- Mark as New
- Bookmark
- Subscribe
- Mute
- Subscribe to RSS Feed
- Permalink
- Report Inappropriate Content
This is what i want
- Mark as New
- Bookmark
- Subscribe
- Mute
- Subscribe to RSS Feed
- Permalink
- Report Inappropriate Content
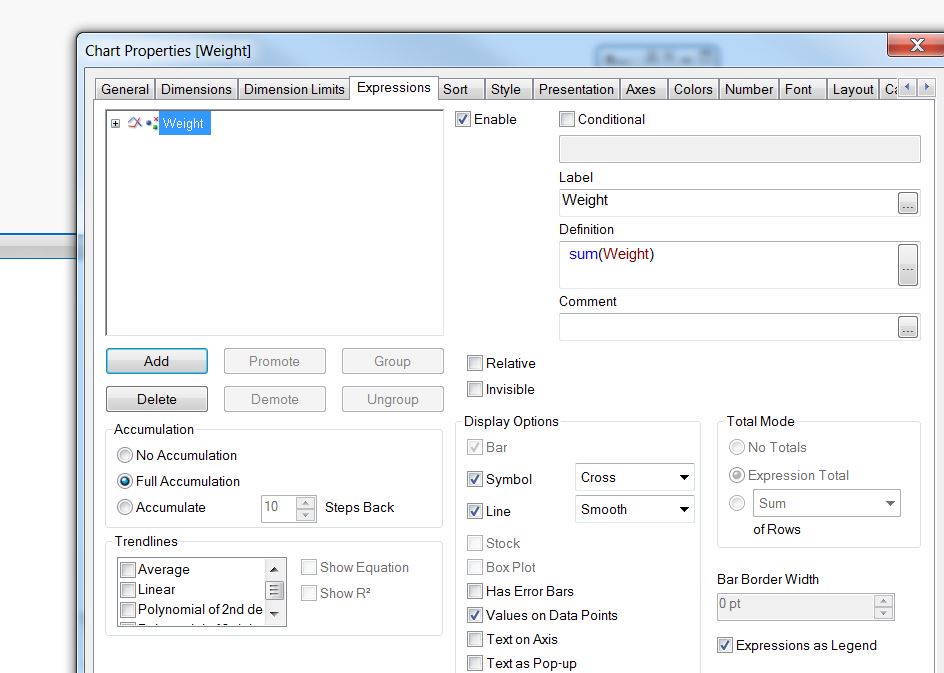
Hi Imran Khan,
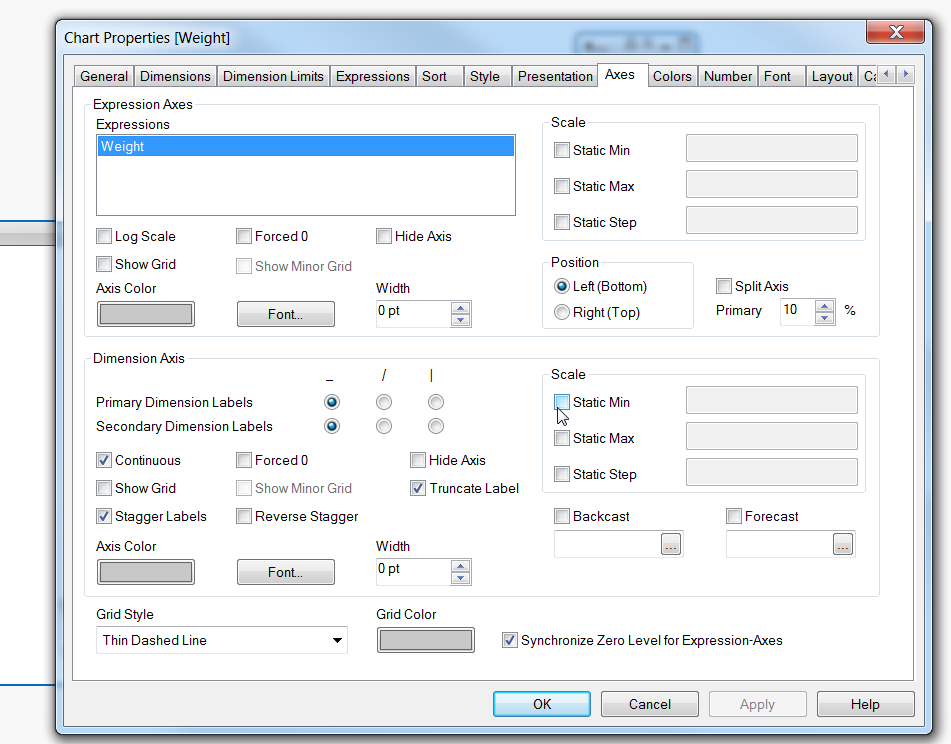
Based on the data what you have this is what I got. you just need to remove the predefined scale to get this.
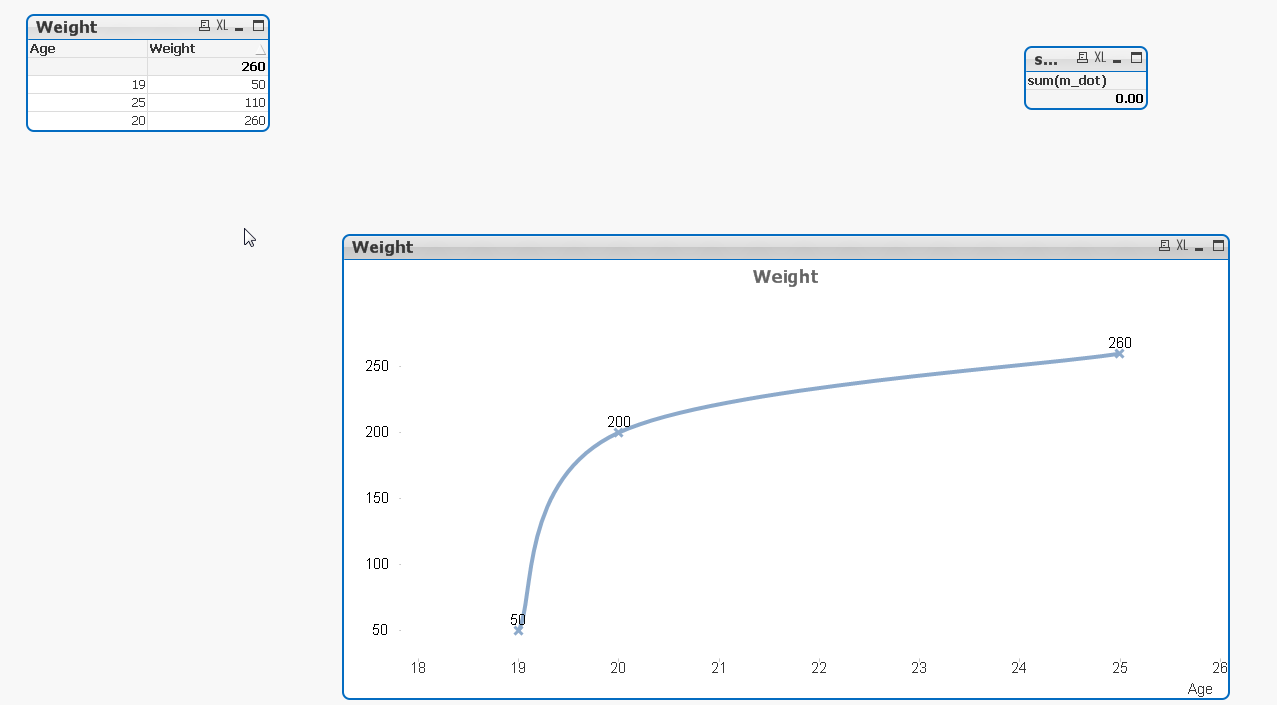
-Siva