Unlock a world of possibilities! Login now and discover the exclusive benefits awaiting you.
- Qlik Community
- :
- All Forums
- :
- QlikView App Dev
- :
- Re: Complicated AGGR
- Subscribe to RSS Feed
- Mark Topic as New
- Mark Topic as Read
- Float this Topic for Current User
- Bookmark
- Subscribe
- Mute
- Printer Friendly Page
- Mark as New
- Bookmark
- Subscribe
- Mute
- Subscribe to RSS Feed
- Permalink
- Report Inappropriate Content
Complicated AGGR
I only want to include rows in which max(DEFECT_STATUS_START_DATE)-min(DEFECT_STATUS_START_DATE)>1 for both the calculation of my Avg # days and the count of DEFECT_ID.
The Avg # days is using a denominator of the total count of DEFECT_IDs instead of just those in which max(DEFECT_STATUS_START_DATE)-min(DEFECT_STATUS_START_DATE)>1 . As you can see, if 10-13 is selected for the month and the Statuses selected are New and Approved, the Avg # days shows 8 but (27+12)/2 which should be 19.5. It's including those DEFECT_IDs where max(DEFECT_STATUS_START_DATE)-min(DEFECT_STATUS_START_DATE)<1.
How can I fix this?
if(max(DEFECT_STATUS_START_DATE)-min(DEFECT_STATUS_START_DATE)>1,$(vAvgDays))
vAvgDays = SUM( Aggr( Max(DEFECT_STATUS_START_DATE)- Min(DEFECT_STATUS_START_DATE) ,DEFECT_ID) )
/Count({$<DEFECT_ID = {"=Count(DEFECT_STATUS_MAP) = GetSelectedCount(DEFECT_STATUS_MAP)"}>}DISTINCT DEFECT_ID)
Same question on the # of defects. It shows 1 when there should be 2 in this case.
Thanks all!
- « Previous Replies
-
- 1
- 2
- Next Replies »
Accepted Solutions
- Mark as New
- Bookmark
- Subscribe
- Mute
- Subscribe to RSS Feed
- Permalink
- Report Inappropriate Content
Try this
Sum(Aggr(If(Max(DEFECT_STATUS_START_DATE)-Min(DEFECT_STATUS_START_DATE)>1,1,0), DEFECT_ID, MONTH_1))
- Mark as New
- Bookmark
- Subscribe
- Mute
- Subscribe to RSS Feed
- Permalink
- Report Inappropriate Content
Hello Cassandra,
Correct me if I understood it wrong,
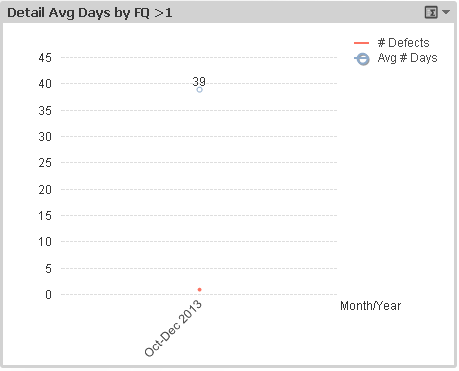
but if you need the value to be 39, just let your vAvgDays variable be:
=SUM(
Aggr(
Max(DEFECT_STATUS_START_DATE)- Min(DEFECT_STATUS_START_DATE)
,DEFECT_ID)
)
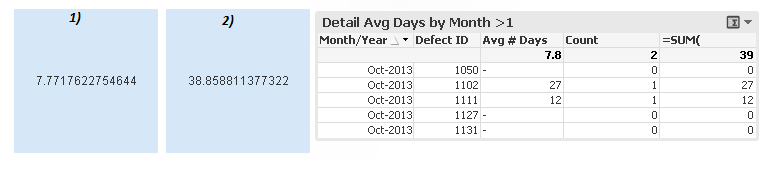
Below is the following:
1) Your number, with the function you defined on the vAvgDays
2) Same expression withouth the denominator (as I pasted above).
And the table has both of them as expressions (just added the 2) expression to the table you aldready had).
Hope it helps,
Felipe.
- Mark as New
- Bookmark
- Subscribe
- Mute
- Subscribe to RSS Feed
- Permalink
- Report Inappropriate Content
I want the average so 39/2.
- Mark as New
- Bookmark
- Subscribe
- Mute
- Subscribe to RSS Feed
- Permalink
- Report Inappropriate Content
I'm looking for the right count, Felip, not the sum.
- Mark as New
- Bookmark
- Subscribe
- Mute
- Subscribe to RSS Feed
- Permalink
- Report Inappropriate Content
- Mark as New
- Bookmark
- Subscribe
- Mute
- Subscribe to RSS Feed
- Permalink
- Report Inappropriate Content
This
Avg(Aggr(if(max(DEFECT_STATUS_START_DATE)-min(DEFECT_STATUS_START_DATE)>1,$(vAvgDays)), MONTH_1, DEFECT_ID))
- Mark as New
- Bookmark
- Subscribe
- Mute
- Subscribe to RSS Feed
- Permalink
- Report Inappropriate Content
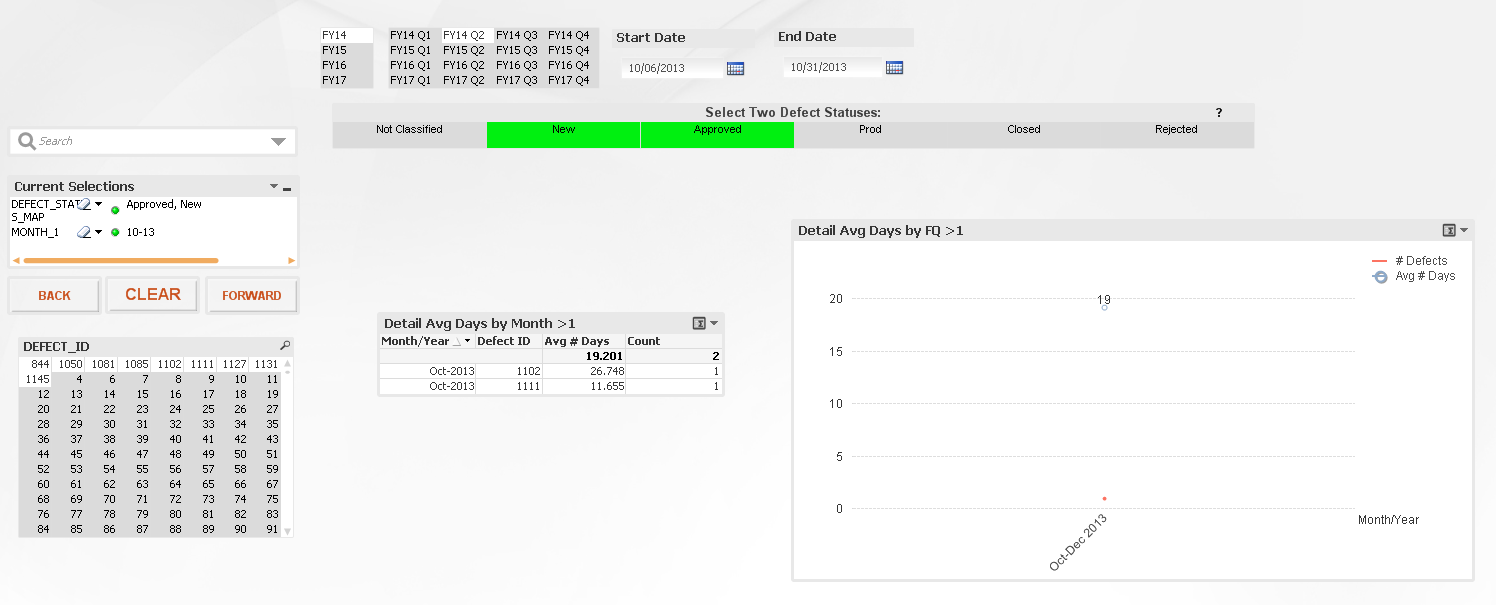
If you select Oct 2013, That doesn't seem to give me any value for Avg # days and also what about the Count formula?
if(max(DEFECT_STATUS_START_DATE)-min(DEFECT_STATUS_START_DATE)>1,1,0)
- Mark as New
- Bookmark
- Subscribe
- Mute
- Subscribe to RSS Feed
- Permalink
- Report Inappropriate Content
Where on the sheet do I select that value?
- Mark as New
- Bookmark
- Subscribe
- Mute
- Subscribe to RSS Feed
- Permalink
- Report Inappropriate Content
It looks like it's already showing only October in your screenshot but you can select it in the straight table.
- Mark as New
- Bookmark
- Subscribe
- Mute
- Subscribe to RSS Feed
- Permalink
- Report Inappropriate Content
So if it is already selected, I see 19 in the chart next to it... isn't that what you want?

- « Previous Replies
-
- 1
- 2
- Next Replies »