Unlock a world of possibilities! Login now and discover the exclusive benefits awaiting you.
- Qlik Community
- :
- Forums
- :
- Analytics
- :
- New to Qlik Analytics
- :
- Re: Cumulative Percentage sum of a row obtained by...
- Subscribe to RSS Feed
- Mark Topic as New
- Mark Topic as Read
- Float this Topic for Current User
- Bookmark
- Subscribe
- Mute
- Printer Friendly Page
- Mark as New
- Bookmark
- Subscribe
- Mute
- Subscribe to RSS Feed
- Permalink
- Report Inappropriate Content
Cumulative Percentage sum of a row obtained by a pivot table in Qlik Sense
Dear all,
I have a big issue and I think that what I have to do goes far beyond my competences.
I have loaded 2 tables in the script, there are other colums but I need only some of them to compute the calculation:
[Purchased]
| Item | Supplier | Quantity | Turnover | Year |
|---|---|---|---|---|
[Database]
| idOrder | Item | Supplier | Machine | Production year | Claim Year |
|---|---|---|---|---|---|
What I need to do is to compute a cumulative sum of the percentage of defects of a single item ( count(idorder)/quantity), for a supplier;
more specifically:
in 2011 I produced and sold a machine;
In 2011 I received 4 claims (4 id.orders) of representing 2 different items [A and B] (for simplicity 2 claims per item); In 2012 i received 2 claims, regarding in this case of the 2 different items considered before;
in 2012 i produced and sold another machine;
in 2012 i received 1 claim, in 2013 a recieved 2 claims.
I have in the table (purchased) the yearly quantity purchased of that specific item, for simplicity Production Year is the same of Purchased Year.
my index should be somthing like this:
| Claim 2011 | claim 2012 | claim 2013 | Purchased | ||||||
|---|---|---|---|---|---|---|---|---|---|
| 2011 | 4/100 = 4% | 2/100=2% | 0% | 100 (total sum of items) | |||||
| 2012 |
|
| 100 (total sum of items) |
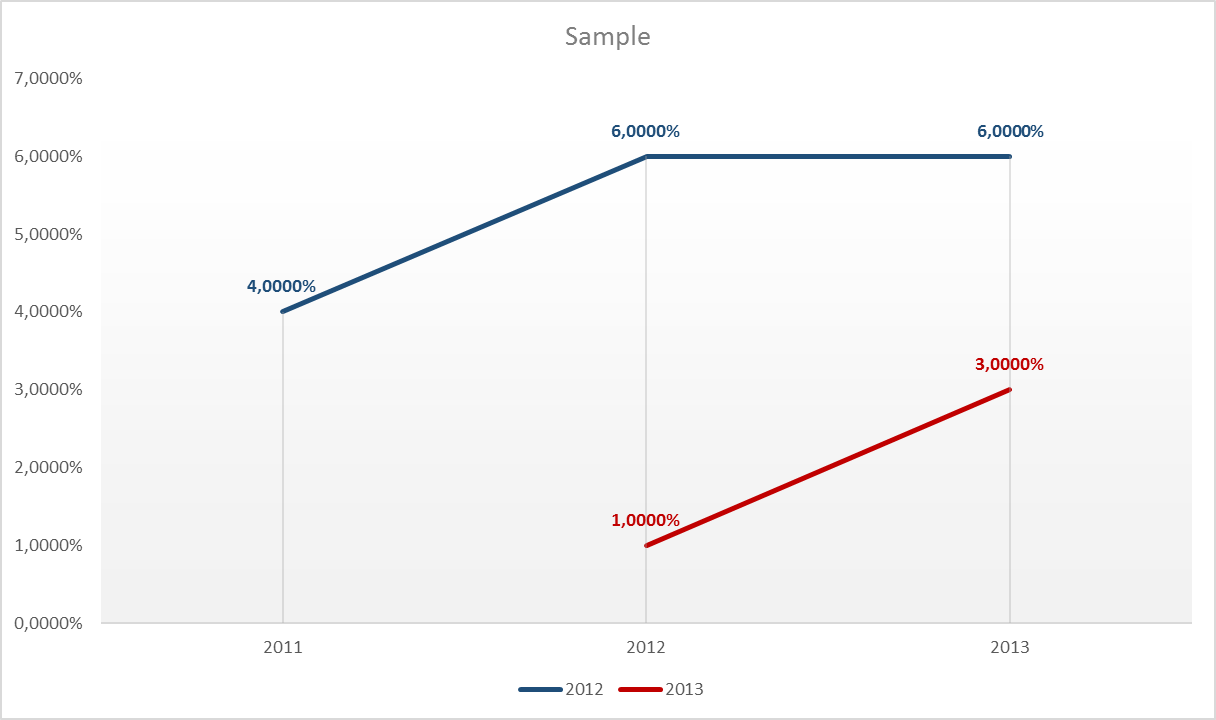
in a graph they would be represented like this:
y : cumulative sum
x : year of claim
This is what I have to do. In excel is simple but too much time consuming. I don't get something in order to do this in qlik sense.
Thank you in advance if anyone can help me
- « Previous Replies
-
- 1
- 2
- Next Replies »
- Mark as New
- Bookmark
- Subscribe
- Mute
- Subscribe to RSS Feed
- Permalink
- Report Inappropriate Content
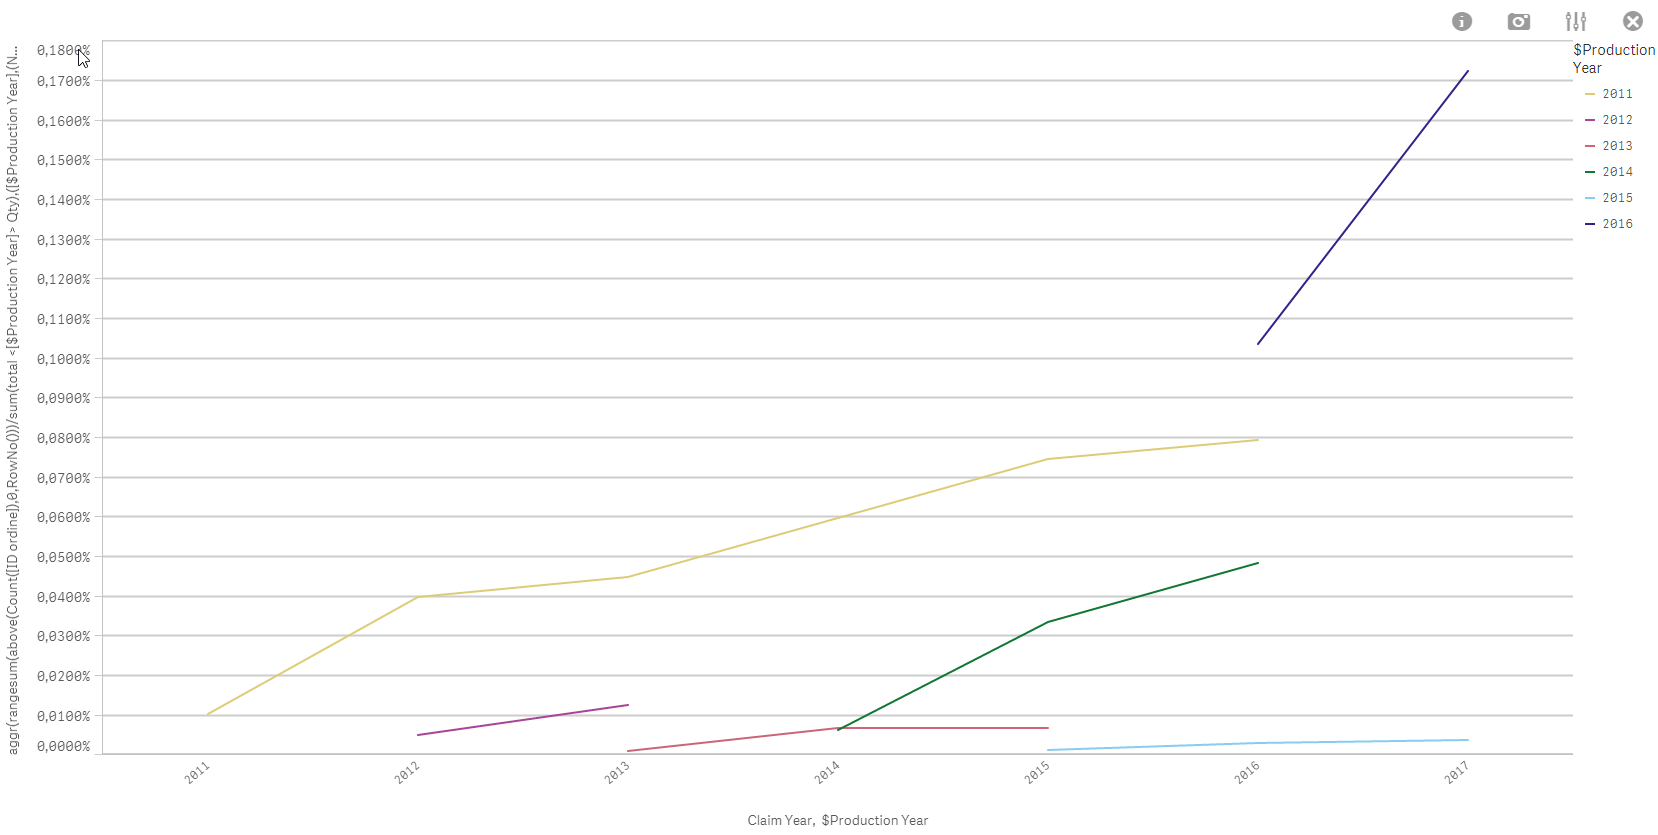
Good Morning Robin,
thank you so much for your help. It works fine, the calculations are right!
I was trying to create the cumulative line graph but It gives me a problem in the expressions. I don't understand why.
How can we solve that issue?
- Mark as New
- Bookmark
- Subscribe
- Mute
- Subscribe to RSS Feed
- Permalink
- Report Inappropriate Content
I think I got it ... expression:
aggr(rangesum(above(Count([ID ordine]),0,RowNo()))/sum(total <[$Production Year]> Qty),([$Production Year],(NUMERIC, ASCENDING)),([Claim Year],(NUMERIC, ASCENDING)))
--> it's a combination of Using inter-record functions: swap x-axis and legend in charts and Running totals per dimension (RangeSum(), sortable Aggr()...)
- Mark as New
- Bookmark
- Subscribe
- Mute
- Subscribe to RSS Feed
- Permalink
- Report Inappropriate Content
Dear Robin,
it works perfectly. Thank you so much for your help. Your explaination in the other threads are so clear, thank you again! 
Regards
Damiano
- « Previous Replies
-
- 1
- 2
- Next Replies »