Unlock a world of possibilities! Login now and discover the exclusive benefits awaiting you.
- Qlik Community
- :
- All Forums
- :
- QlikView App Dev
- :
- Re: Multiple Summaries by Months, YTD, and Prior Y...
- Subscribe to RSS Feed
- Mark Topic as New
- Mark Topic as Read
- Float this Topic for Current User
- Bookmark
- Subscribe
- Mute
- Printer Friendly Page
- Mark as New
- Bookmark
- Subscribe
- Mute
- Subscribe to RSS Feed
- Permalink
- Report Inappropriate Content
Multiple Summaries by Months, YTD, and Prior Years
Hi,
I've attached an excel spreadsheet with what I would like my qlikview chart to display, and I've also attached a picture of what I've already done - I'm using a pivot table with Month([QA Report Date]) as the dimension, and a few different summaries of fields as expressions... I'm just wondering if it's even possible to have a YTD column and previous years columns, along with the month columns I already have?
This seems like it will be extremely difficult to do (if it's even possible), so my thoughts were I would just have to create more than one chart? (It is preferred that no scripting be added).
Any help is appreciated.
Thanks,
Ben
- Mark as New
- Bookmark
- Subscribe
- Mute
- Subscribe to RSS Feed
- Permalink
- Report Inappropriate Content
I guess it is possible with a little complexity.
Can you share some sample data.
- Mark as New
- Bookmark
- Subscribe
- Mute
- Subscribe to RSS Feed
- Permalink
- Report Inappropriate Content
Check this out.
- Mark as New
- Bookmark
- Subscribe
- Mute
- Subscribe to RSS Feed
- Permalink
- Report Inappropriate Content
I'm unable to open your .qvw, could you screenshot your solution?
Ben
- Mark as New
- Bookmark
- Subscribe
- Mute
- Subscribe to RSS Feed
- Permalink
- Report Inappropriate Content
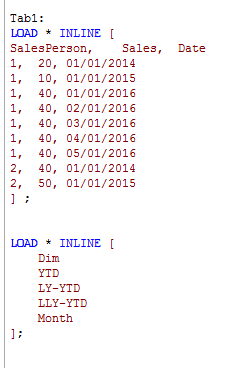
Table:

Dimension:

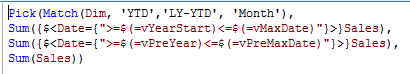
Expression:
Script: